

Commentary
RTB Month In Review: February 2013
- by Tyler Loechner , Staff Writer @mp_tyler, March 22, 2013
 It's
ironic that a real-time blog would be blogging about the month of February when April is only about a week away, but February's data is still very relevant today. The data comes from the new real-time marketplace app from Rubicon Project. Even though
this data is about real-time, it isn't released in real-time. As RTM Daily wrote back in February: "Currently...each month’s data is refreshed within two weeks of the next month...Rubicon
is looking into ways of making the data even more immediate and real-time."
It's
ironic that a real-time blog would be blogging about the month of February when April is only about a week away, but February's data is still very relevant today. The data comes from the new real-time marketplace app from Rubicon Project. Even though
this data is about real-time, it isn't released in real-time. As RTM Daily wrote back in February: "Currently...each month’s data is refreshed within two weeks of the next month...Rubicon
is looking into ways of making the data even more immediate and real-time."
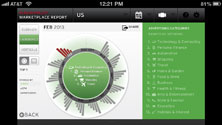
Helen Jen, director, product marketing at Rubicon, walked me through the app and everything I was looking at. Jen said that while all of the numbers are standardized, they are based on actual data gathered from the Rubicon Marketplace.
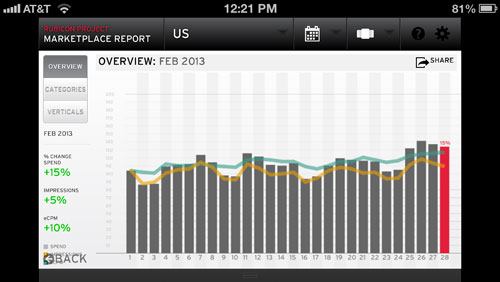
The month of February was big for real-time in the United States. There was a 15% increase in spend, a 5% increase in impressions, and a 10% increase in eCPM. By comparison, RTB had an 11% increase in spend, 2% increase in impressions, and 8% increase in eCPM on the global scale. All percent increases and decreases are in relation to the previous month.
In the US, the most spending happened in the Technology & Computing category. Surprised? I'm not, either.
Personal finance, automotive, shopping, and travel rounded out the top 5 advertising categories in terms of spending. That spending ultimately related directly to impressions; the same five categories filled out spots 1-5 (in the same order, no less) as ranked by impressions.
Food & Drink led all categories as ranked by eCPM, a category it hadn't led in since August 2012. Shopping, travel, and automotive were also among the leaders in terms of eCPM, and were the only three categories to be in the top 5 in each of the app's three categories.
News advertising was a big winner in February, ranking 5th in eCPM after ranking 16th and 15th in January and December, respectively. February also marked the first time that News ranked in the top 5 since June 2012.
For the second straight month, Shopping was the leading vertical as ranked
by revenue in the US. Globally, shopping ranked 3rd in the category for the seventh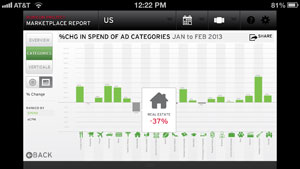 straight month.
The highest and lowest percent change in spend among individual ad categories in February belonged to Real Estate (down 37%) and Hobbies & Interests (up 105%).
In all, February was a solid month for RTB. A bounce back in the market was expected because January saw large drops in spend (-42%) and impressions (-23%). Even though a recovery month shouldn't come as a surprise, it was just the second time since May - and first since November - that the US's numbers beat the global average in terms of spend and impressions.


Tyler Loechner is a MediaPost Reporter covering real-time, programmatic, RTB and more. You can reach Tyler at tyler@mediapost.com.
A healthy report for certain. However,it's still a bit mind-blowing that we see the kind of drops in spending every January. One of the promises of RTB is to remove the human inefficiencies that have plagued the buy-side since our industry's inception. While the January dip is no doubt partially due to seasonality, there still appears to be significant impact on spend, especially in the first two weeks of the year, from people simply not being at their desks to execute buys.