

Sticky: Only 14% Of Online Ads Are Seen
- by Tyler Loechner @mp_tyler, October 10, 2013
 Sticky, a company with software
that uses webcams to track users' eye movements to verify whether or not online ads are actually seen, on Thursday released data which supports the argument that viewability does not equal being
seen.
Sticky, a company with software
that uses webcams to track users' eye movements to verify whether or not online ads are actually seen, on Thursday released data which supports the argument that viewability does not equal being
seen.
"Viewability" describes whether or not an ad could be seen on a page without needing to scroll down, "X" out of something, change tabs, etc. While viewability metrics would suggest that close to 50% of ads are seen, Sticky's data says it's actually just 14%.
Sticky looked at the performances of ten different brands across five different sites with two ads per site. The sites used were yardbarker.com, weather.com, realeastate.com, washingtonpost.com and instyle.com. The study dealt only with impressions that were already viewable.
Washingtonpost.com had the strongest performance, with 51% of the ads in "Placement A" being seen. 40% of the ads in washingtonpost.com's "Placement B" were seen.
Instyle.com had the worst performance. Just 10% of its Placement A and 19% of its Placement B ads were seen.
Weather.com (45% for A, 31% for B) and realestate.com (20% for A, 33% for B) had noticeable, but not drastic, changes between the performances of Placement A and Placement B. However, yardbarker.com had the biggest difference between the two placements. Its A ads were seen just 19% of the time, but its B ads were seen 44% of the time.
Jeff Bander, Sticky's president and chief change agent, hopes Sticky's technology will help boost the number of ads that are actually seen. As publishers get more of this type of data and start to take advantage of it, Bander hopes it will bring more brand dollars online.
"About 94% of branding dollars are offline," he said. "Habit is a lot of that, but studies say CMOs are asking what it would take to move more dollars online." He added, "Brand lift and purchase intent [numbers] are always higher when more people see the ad and look at it longer. Those two measurements — of percent seen and time — have a direct correlation to brand lift, which is the main reason people are advertising brands online."
Right now, the data collection takes about 48 hours, but it will
"eventually be real-time," Bander told RTM Daily. He hopes to have the data collection entirely automated by the end of 2013.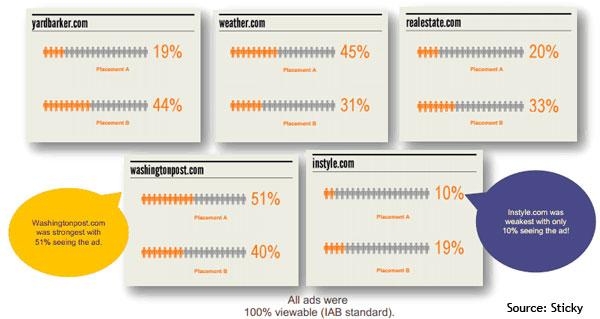

I think it would be helpful to know how many people actually view TV commercials or what the benchmark numbers are for outdoor like billboards and bus shelters. It's hard to put this into perspective.
Matt,
You are so right.
The digital world is so measurable it is a double edged sword.
TV ratings can say 40% watched a show, but what they mean is a percentage of people had the opportunity to watch an ad. The consumer could be in another room or on vacation. If the TV is on and they are a metered home, it counts.
Outdoor and Radio are even more creative.
As digital continues to use new technology to become the most transparent media on earth, the branding dollars will come.
With 94% of all branding offline the future looks very bright.
I "get it" but would also like to know more about the differences in engagement between the sites' audiences. I'm guessing that news/information sites like WashPo & Weather.com may attract a more engaged audience who spend more time overall with the site leading to higher "seen" rates than a potentially less engaged entertainment (InStyle) audience who spends less time on the site and, therefore, sees less.
Unlike TV or billboards, online ads suffer from bot traffic, intentional and unintentional fraud and a brutal amount of clutter. The online industry is now sufficiently well-established that we can stop leaning on the argument that "well, other media aren't perfect, either". We can and should clean up our own house. Tools like Sticky are a good start. To date, online's success has been largely built on direct response advertising. DR marketers can afford to price unseen ads into their models -- as long as the cost-per-conversion works nothing else really matters. But brand marketers need to be reasonably certain that actual humans will see their ads, and today's 86% failure rate isn't inspiring. Digital can do better, and I am convinced it will.
How many of the 14% are even in the United States? I agree with the "double-edged sword" reference, but TV & Radio can get good info on who is exposed to an ad (albeit not as granular) with the Nielsen/Arbitron people meter. That's the real reason Nielsen bought Arbitron. Looks like Comscore scored from that (per the FCC.) Back to this article. If online campaigns are big enough or targeted enough, you can probably read the impact in a Marketing Mix Model.
As far as billboards and bus shelters... well if people who buy those are happy with results, I won't comment any further. They key to any good campaign is the ability to hit a target in as many places as they can stand without hitting "wear-out" so really, instead of shooting down the veracity of one versus the other, look for the synergies that a well-executed campaign can deliver in any/all media.
Is there a link this research anywhere? I cannot seem to find it on Sticky's webpage.
Here's what's fascinating... Half a century ago the Advertising Research Foundation published a model that clearly showed the numbers process from distribution of ad potential through actual audience down to taking action. Amazing to me that these guys merely re-hash that idea and get page space for it. (Oh, and the ARF in the last couple of years fell prey to the idea the model needed to be updates...and made it so frickin' complicated it now make no sense and is unusable. Progress...)
@Matt +1000. What ARE the benchmarks? Also what does "seen" mean - I can "see" my entire screen without moving my eyes; just not in much detail. Do they mean "focussed on", or "noticed" or "read" or "remembered", or something else?
The more I read about this subject the more confused I am. It seems the factors that make all these stats are dynamic and there isn't a silver bullet or a one size fit all model to measurement. Or is there?
For Jeff Bander: can you please elaborate on how the test subject were selected, who they are, how many for each website measured? Did you recruit a demographically representative sample that matched the websites' profiles?
thanks,
Gerard
In response to an article last month about eye-tracking, I cautioned marketers to be careful what they wished for lest they discover no one is looking at the ads. This sentence -- "While viewability metrics would suggest that close to 50% of ads are seen, Sticky's data says it's actually just 14%." -- would seem to confirm my view of things. I can see the T shirt from the TV guys now: So many metrics...so little time.
While I don't have any US data, I do have some Australian data. We conduct 'co-incidentals' with the panellists during the year. We find that they basically log in when they are supposed to (in a room with the TV on and the volume turned up). There are some people who forget to log-in - but then are some who forget to log-out and they basically net each other out (there is also an edit that removes them after a duration of greater than the average programme). It's harder to quantify "viewing" of the ads, but we tend to see the same sort of compliance levels during non-programme content minutes and programme content minutes. Inspection of the minute-by-minute data when it is lined up to ad-breaks shows lots of channel switching (i.e. they are pressing their buttons, even when they leave the room). An analysis I did a few years ago of one week's prime time viewing for one market for the commercial stations here showed a drop off of around 8% in the middle minute of the break and around 3-4% at the start and end of the break (I suspect it is slightly higher now). But the interesting thing is the number of times I found viewing INCREASING in ad breaks - which puzzled me. It turned out that during synchronised ad breaks you would see this happening - and you knew that there was a person at the end of it because someone had pushed the button on the remote control. Regarding Out-of-Home the number of people who see an advertising 'face' is largely dependent on the face itself. Things like size, angle to the road, elevation from the road, illumination, obstruction, distance from the kerb, which side of the road, distance to the sign were all key factors. But across all formats it would be safe to say that of all the people that pass a sign (an opportunity-to-see) it would be something like 35%-40% (as a very blunt average) who did see a sign (likelihood-to-see). This was based on analysis of hundreds of hours of eye-tracking. Some signs had 90+% LTS which we checked and double-checked. They were large 'overhead' signs on major roads - signs on walkways, flyovers etc. Basically, if you're driving you car straight at an overhead sign it's darned hard NOT to see it and I don't want to be near any driver who doesn't see it! I hope this helps.
Oops. My point is that during synchronised ad-breaks people were switching out of one ad-break and landing (and settling) on an ad-break on another channel.
John, your 3-year-old data doesn't account for the subsequent and now ubiquitous proliferation of TV viewers engaged with second and third screens. The meaningful metric here isn't the number of ads that are seen, but rather the vast majority -- across all media -- that aren't.
As George Box once said, "All models are wrong. Some are useful." We will never know with precision where everyone's attention is, but I find directional numbers like John's to be genuinely useful. The only truly meaningful metric is year-on-year sales but in the meantime we need something, however flawed, to steer by. Media's ability to deliver reach and attention is fundamentally shifting in ways that make marketing more difficult. It's pointless to try to wish this away; the only way to make progress is to see things as they are and do our best to learn and improve.
as an old broadcast salesman when selling against newspapers we always used the "seen and noted metrics of less than 10%...so there you go...it's not the percentage but the results
What we see in our data at Proximic may be useful to consider. An ad's "noticeability" as we call it is dependent on page design and the proximity of other elements near and around the actual ad unit. In cluttered ad environments that come with fashion sites the competing imagery tends to move the eye toward what you are there for, the fashion content. The supporting images and sub-navigational elements not only provide eye clutter (the eye processes images much faster than words) but draw the eye away from the actual advertising.
News based sites or more professional edited sites tend to have more white space with clearly defined zones if you will and the content engagement is different, less image focused and more text heavy.
There is no magic bullet and viewability definitely is not that, however the more data we look at to help truly define a "premium" ad placement the better we can reduce wasted ad spend across the industry. As for our data, yes, this data is provided pre-bid.
Once all the data falls away, we are still in a communications medium and both the ad environment in which content is delivered and the ad message delivered there has to make sense.
Question... Sweepstakes Today has published over 42,000 sweepstakes, contest and giveaways in text. Have you broken down the numbers if there was a promotion included? By my numbers, I have seen 20 to 30 percent of all new major brand ads have a promotion within the ads. Second, have you done any studies on banner ads verses text link? Example we work direct with a number of major sponsors. They will see very high click rates on text link sweepstakes that have a great prize. I know for a fact that an ad with no promotion with no promotion will do far worse than one that does. Comment?
Mike, while I take your point that device proliferation is rapidly increasing (and that that the way we 'watch' on those devices is/can be very different) this question from Matt that I was responding to was regarding watching "television" rather than watching "video content". Yes the numbers will have changed a bit (as I noted) but I still think they would be in the ball-park. I am sure they would be much closer than you assertion of the "now ubiquitous proliferation of TV viewers engaged with second and third screens". I remind you that 'ubiquitous' means "existing or being anywhere, omnipresent". Looking at publicly available data for the US most sources place smartphone penetration at around two-thirds and tablet penetration at one-third. I think my data remains closer to the mark than your assertion, especially as penetration does not equal usage. Ad avoidance has been around for decades if not since the invention of electronic broadcast media and brands seem to have done OK with their ability to sell products, and I see no empirical evidence of second and third screens changing that. Ad avoidance is what it is and is what it has always been - and good marketers and media planners know that and take it into account when both constructing campaigns and more importantly when conducting post-campaign sales effectiveness analyses.
Tom, wise words indeed. Are your George Box quote is one of my favourites, along with Einstein's "Not everything that matters can be measured, and not everything that can be measured matters". This is an odd thing for a statistician to say ... but sometimes precision is overstated. For example, GPS is much more accurate that a sextant and ancient maps - yet Magellan seemed to do OK with them. Cheers.
Every medium has problems: http://markets.financialcontent.com/stocks/news/read/25318973/Council_For_Research_Excellence_Study_Finds_Widening_Relative_Error_In_Television_Diary_Samples?goback=%2Egde_2887046_member_5794045462927388673#%21