The Relative Cost Of Trading Between Segments
- by Tyler Loechner @mp_tyler, July 18, 2013
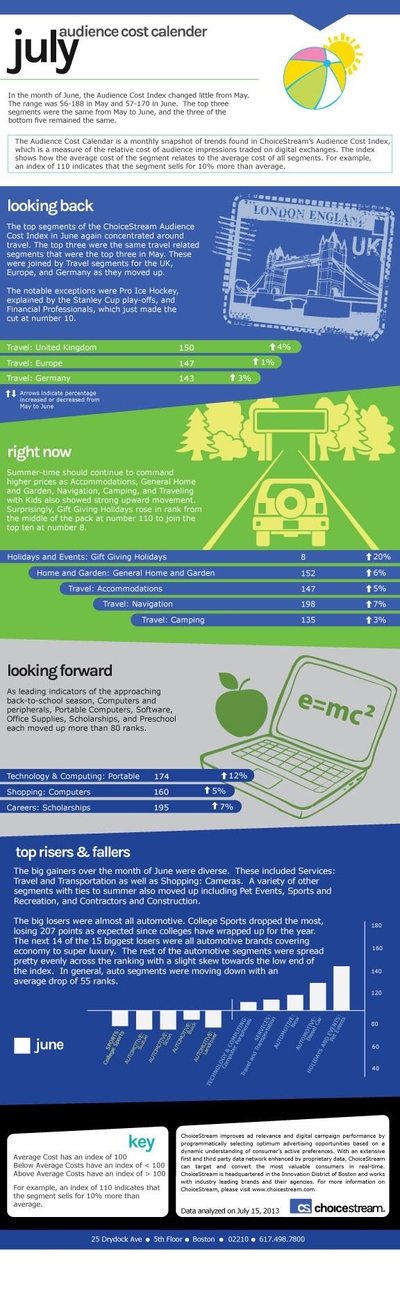
ChoiceStream this week released their July Audience Cost Calendar (which consists of data from June), a report that looks at segments trading programmatically and gives them a score based on an index. A "100" rating indicates that a particular segment is trading at the average of all segments. A "120" would indicate trading 20% above average, etc. It's all about finding the relative cost of trading in one segment versus another.
As June marked the start of summer, several summer-related segments were risers. Shopping: Cameras, Pet Events, Sports and Recreation, and Contractors and Construction were all among the risers.
ChoiceStream wrote that "the big losers were almost all automotive," and that "14 of the 15 biggest losers were all automotive brands covering economy to super luxury."
The range of the index was 57-170. The range in the previous cost calendar was 56-188. This is of particular interest because just last month, Bill Guild, vice
president, product management and marketing at ChoiceStream, told
RTM Daily that the spread has been widening monthly, yet this month it shrunk.
The full infographic is included below.