
January 25, 2023

Ad Market Saturates, Costs Begin Deflating: Even Prime-Time Not Immune
- by Joe Mandese @mp_joemandese, April 3, 2015
In what could be the first material sign that even network prime-time TV is not immune from the physical laws of a rapidly expanding media universe, the average cost of broadcast prime-time inventory has eroded for the first time since the recession. While the rollback is small -- the average prime-time cost-per-thousand (CPM) of buying adults 18-49 on the broadcast networks fell 2.4% to $43.06 in 2014 -- the fact that it declined at all during a non-recessionary period may signal that even the most premium advertising inventory has hit the wall on Madison Avenue.
“The numbers we’re looking at don't represent a significant decline, but it’s rare to see it go down at all,” notes Neil Klar, the founder and CEO of SQAD, who has been tracking TV advertising costs for Madison Avenue for decades.
Klar, who provided a snapshot of recent CPM trending for network prime-time, online video and online display advertising over the past several years, noted that the price for all classes of “converged” media are trending downward, and said “it’s hard to say why it happened.”
advertisement
advertisement
That said, he cited several factors that likely are contributing to the reset of premium advertising costs, mainly the rampant proliferation of media options, the shift toward a “convergence” way of planning and buying TV and digital media, and the increasing role of programmatic media-buying, which is unlocking vast amounts of lower-priced inventory for advertisers to target their audiences -- often more precisely, efficiently and for lower costs than conventional methods of buying directly from media sellers.
In the long run Klar believes -- as many others do -- that programmatic will put upward pricing pressure on all forms of advertising inventory as buyers and sellers reset market values around the most precisely targeted segments of the inventory they trade, but in the short-run, SQAD’s trending data indicates there has been a halt to media inflation.
While the decline of network prime-time CPMs isn’t significant, the SQAD data also shows that digital advertising inventory is also deflating, including premium online video advertising, which has been seen as scarce and in high demand.
While the average CPM of in-stream online video advertising fell only 0.6% in 2014, the fact that it declined at all in what appears to be a land rush for premium online video is a telling sign, says Klar, adding that the fact that TV buyers and sellers typically “package” broadcast TV and online video inventory together might be a mitigating factor. In other words, the networks may be robbing from Peter to pay Paul -- or using premium online video in packages to help their network prime-time CPMs from eroding even faster.
Other premium media are not immune from this trend either. The SQAD data shows that the average cable network prime-time CPM -- the next most valuable television inventory after broadcast prime-time -- also eroded in 2014, falling 3.3% to an average of $15.11 in 2014 from $15.63 in 2013.
But the rollback of prime-time broadcast network CPMs is especially noteworthy, says Klar, because historically it appeared to have inelastic demand from advertisers, despite the rampant erosion of prime-time audience deliver. Even as the average network TV rating has declined over the past 20-plus years, the average CPM has risen as the broadcast networks adjusted their prices -- and advertisers’ costs -- upwards, based largely on the assumption that network prime-time inventory was growing increasingly scarce and precious amid the hyper-fragmentation of the media marketplace.
The principle suggested that network prime-time inventory was precious because it was not interchangeable with other forms of advertising -- that it delivered a bigger bang for an increasingly inflationary buck. But Klar says many big network TV advertisers are rushing toward digital media -- especially online video -- and likely see network prime-time as being more interchangeable and replaceable in their media mixes.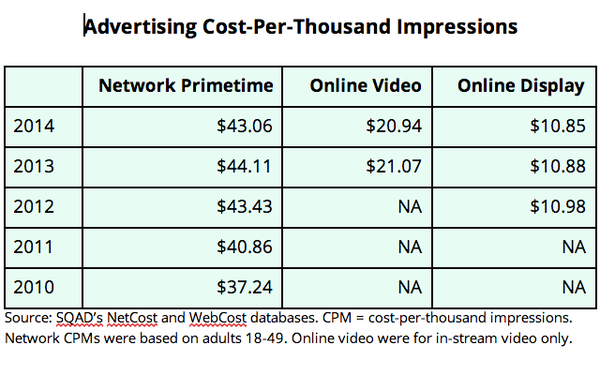
6 comments about "Ad Market Saturates, Costs Begin Deflating: Even Prime-Time Not Immune".
Read more comments >
Next story loading 
If network CPMs are based on Adults 18-49, what are the online CPMs based on? Are they reported in gross dollars as network typically is?
The chart makes it look like online video CPMs are half the cost of primetime and I do not believe that is the case.
Interesting data, Joe and Neil. What the broadcast TV prime comparisons may also indicate are the effects of the progressive aging of network audience delivery---the median age of their prime time audiences---average minute audience, that is---now stands at about 57years. This means that the 18-49 "targeting" demo now represents a shrinking minority of the broadcast TV prime time audience, with almost half of it being 60 or older. It may be time for advertisers and sellers looking for a more representative "demo" for GRP guarantee purposes, to shift to a broader base---perhaps 25-64, for example.
Darrin, while we await Joe's reply to your question, let me chime in. Our own tracking indicates that representative online video CPMs for so-called "untargeted" "15s" and "30s" are on the order of $23-24 for all users, regardless of sex, age, etc. Translating these norms down to adults 18-49 would certainly see a major increase----to the neighborhood of $35-40 ---- and that's not accounting for ad "viewability" issues.
SQAD did not specify whether the CPMs were derived from net or gross, but I would assume the latter. I believe all the CPM values were calculated on the same basis, because SQAD didn't point out any differences. More info about their methods can be found at www.sqad.com. The display and in-stream video costs were not based on an audience segment, so take what you will from a comparison with prime 18-49.
WebCosts Average CPM - Display
2012 Display All Categories: $10.98
2013 Display All Categories: $10.88
2014 Display All Categories: $10.85
WebCosts Average CPM - In-Stream
2013 In-Stream Composite Same Site: $21.07
2014 In-Stream Composite Same Site: $20.94
So the primetime CPMs are equivalent :30s for 18-49 on just broadcast network. Streaming is non-equivalent total day total people? Mama Mia, that's one misleading chart!
@Darrin Stephens: Misleading in what way? The chart notes that network CPMs are based on A18-49. It's up to readers to determine whether there is a basis of comparison. The main reason for publishing it is to show each platform's relative CPM trend line. They're all down. That's the point of the story. The big news is that network prime-time CPMs are down.