

Nielsen: Streaming Minutes Up Again In March's Last 2 Weeks; Netflix Gains Share
- by Karlene Lukovitz @KLmarketdaily, April 9, 2020

Streaming TV minutes continued their dramatic growth during the last two weeks of March, according to Nielsen’s latest streaming TV report updating activity during the COVID-19 pandemic.
The new report also shows a continuation of streaming’s dramatic increase in share of total TV time, which was at 24% and 23% in those two weeks, respectively, versus 14% in each of last year’s comparable weeks. (Chart below.)
Streaming’s share of total TV time was also 23% as of the week of March 16 this year, per Nielsen’s last report.
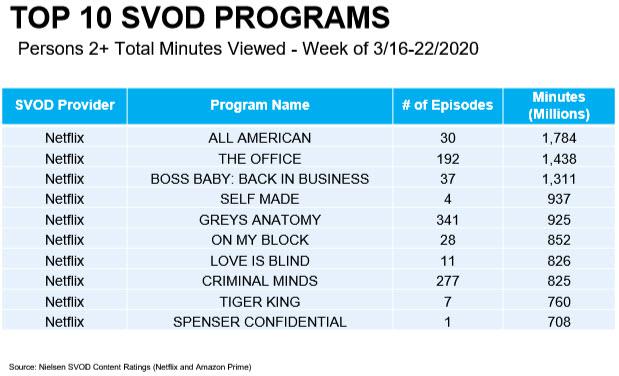
Leading SVOD Netflix monopolized the entire top-10 viewership ranking (chart below), and ended March with 33% share of streaming minutes — up from 29% as of the week of March 16.
Total streaming minutes in the third and fourth weeks of March were 168.7 billion and 161.4 billon — way more than double the 76.4 and 69.8 billion minutes recorded, respectively, in the comparable year-ago weeks.
The last two weeks’ streaming minute totals were also up from the first two weeks of March 2020, which were 127.6 billion and 156.1 billion, respectively.
Using the same comparison weeks, Hulu gained two percentage points of share (to end March at 12%), while #2 YouTube lost one point (to 19%), and Amazon lost two points (to 7%).
But March’s last two weeks also continued the uptrend in the share of streaming minutes grabbed by “other” SVODs — a category that currently includes Disney+. (The new Disney streamer isn’t yet reported on by Nielsen, but has just announced that its total subscribers now exceed 50 million).


I want to see if I am understanding the data in this report correctly.
All American is the clear #1. 30 episodes garnered 1,784 million minutes across the 30 episodes viewed in that week via SVOD.
So doesn't that mean that the average episode had total viewing time of 60 milliom minutes?
The episode duration ranges from 42 to 49 minutes (per Wikipedia). So let's say that the typical episode is 45 minutes.
So isn't the averaghe minute audience the 60 million minuites divided by the 45 minute duration - or 1.33 million average minute audience?
Or have I misunderstood the data or terminology?
John, from what I can tell in the tables, I believe that you are correct. I wish that Nielsen would stop citing confusing---but large---volumetric numbers like total minutes and simply report the data the same way for SVOD as it does for TV.