

Commentary
Premium Video Ad Views +45% In H2 2021, Roku, Fire TV Lose Share
- by Karlene Lukovitz @KLmarketdaily, April 1, 2022

Premium video ad views in 2021’s second half were up 45% year-over-year, according to the latest video marketplace report from FreeWheel, based on aggregated data from its advertising platform.
That reflects both the growing number of ad-supported streaming options and growing adoption of them as consumers’ tolerance for multiple service fees begins to reach its limits.
Device-wise, big-screen viewing continues to rule. Connected TV (CTV) devices had 63% of ad views (up 1% YoY) and set-top box video-on-demand 14% (flat YoY), for a combined big-screen share of 77% (chart top of page). Mobile’s share of ad views rose two percentage points YoY, to 10%, while desktop’s declined from 16% to 13%.
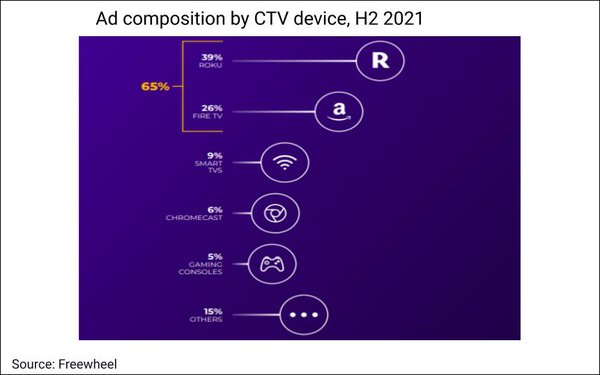
The biggest shift was seen in the competitive scenario within CTV devices. Roku and Fire TV continued to dominate, with ad-view shares of 39% and 26%, respectively, for a combined share of 65%. However, that was down from a combined 72% in H2 2020, when Roku had 43% and Fire TV 29%.
advertisement
advertisement
Gaming consoles also lost share YoY (down from 8% to 5% of views), as did Chromecast (down from 7% to 6%).
Meanwhile, smart TVs gained two percentage points, for a 9% share, and “other” device options rose from 6% to 15%.
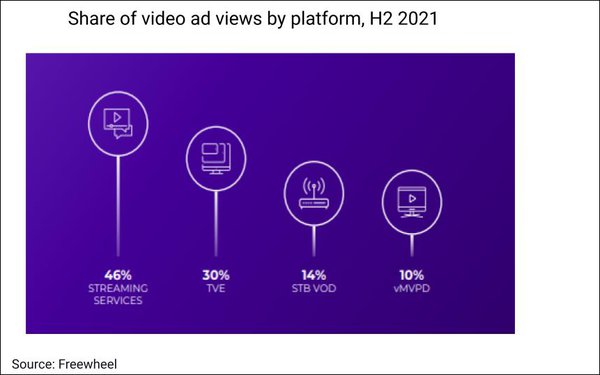
Direct-to-consumer streaming services’ ad views surpassed those of traditional cable and satellite operators’ “TV everywhere” (TVE) viewing options for the first time in first-half 2021, and reached a 46% share of views across video distribution platforms in the second half. (As of second half 2020, streaming services were at just 38%, to TVE’s 40%.)
Fed by private marketplaces and new guaranteed transaction models, ad views generated by programmatic buys were up 80% YoY, although their share of H2 2021’s overall larger pool of ad views was actually slightly lower (23%, vs 24% in H2 2020).
The number of direct-sold the number of direct-sold campaigns using audience targeting grew by 54%, with even more growth (unspecified) through programmatic channels, according to the report.
The growth was driven by behavioral targeting, which saw its share of targeted audience segments rise from 51% to 61% year over year, while demographic data’s share declined from 49% to 39%.
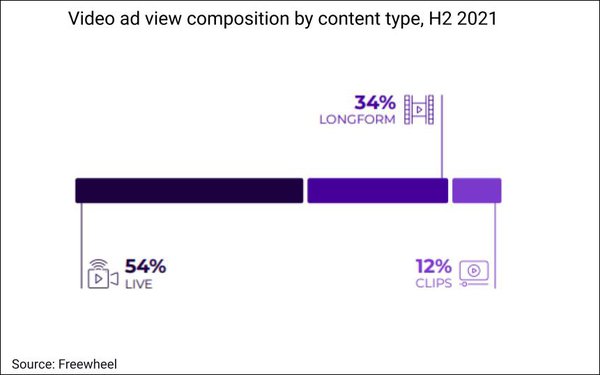
While the popularity of video-on-demand (VOD) is unabated, as in H2 2020, more than half (54%) of ad views were generated by live TV, as viewers used virtual multiplatform video distributor services (vMVPDs) such as Pluto TV, Sling TV and Xumo to watch live events and 24/7 scheduled streaming channels.
Still, despite live’s dominance, and despite events including the Summer Olympics, MLB playoffs and most of the NFL season being in play during last year’s second half, sports content accounted for just 4% of ad views.
News accounted for another 6%, but fully 90% of ad views were occurred during entertainment content.
Within the 46% of VOD-generated ad views, longform content generated 34% and clips 12%, essentially the same as in H2 2020.


Karlene Lukovitz is editor of MediaPost's "Digital News Daily" and writes the weekly "Video Insider" and "Advanced TV Insider" columns. You can reach her at karlene@mediapost.com.