Nielsen Completes Cable Universe Review, Concludes November's Decline Was Accurate

Nielsen has completed a review of its cable universe estimates for November and determined that the original estimates were, in fact, accurate and is re-releasing them today. On Oct. 30, Nielsen temporarily withdrew the estimates due to concerns about a “larger than usual change as compared to the prior month.”

Following a thorough review of its processes, Nielsen said it has verified that “November estimates were accurate as originally released and that all the processes that go into the creation of the estimates were done correctly.

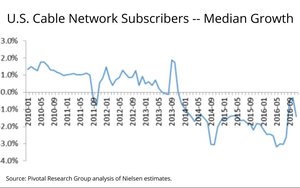
“The month over month decline in coverage that most cable networks saw was driven primarily by an overall decline of approximately half a percentage point (.55) in the ‘cable plus’ universe, meaning fewer households are subscribing to cable through” a conventional cable, telco of direct broadcast satellite provider.

advertisement

advertisement

“The decline was not specific to a network or group of networks, meaning, not driven by household changes in tiers or packages,” Nielsen continued, adding that it currently is “researching new and emerging technologies and multichannel providers such as ‘virtual MVPDs’ and will incorporate these households into the Cable Network Coverage Area Universe Estimate definition at a future date and in cooperation and agreement with our clients.”

The development is another indication that American consumers are shifting their consumption to over-the-top video services such as Netflix and Amazon vs. traditional MVPDs.

Despite some grousing from Disney’s ESPN unit, Wall Street analyst Brian Wieser issued a note indicating the incident, as well as similar previous one, “serves to highlight that complaints from media owners or others who would benefit from adjustments to the data regarding Nielsen or any other audience measurement provider should generally be taken with a proverbial grain of salt.”

Wieser, a former Madison Avenue executive who is now an analyst with Pivotal Research Group, added, “In fact, they should often be ignored. By contrast, concerns made by the agencies and advertisers who have to justify budget allocations around the quality of a measurement service provider’s methodology should be viewed as having greater importance.”

He concluded the data indicates ESPN has experienced a 3.1% universe decline.

ESPN issued a statement, characterizing the universe update as an anomaly: "This most recent snapshot from Nielsen is a historic anomaly for the industry and inconsistent with much more moderated trends observed by other respected third party analysts. It also does not measure DMVPDs and other new distributors and we hope to work with Nielsen to capture this growing market in future reports.”

10 comments about "Nielsen Completes Cable Universe Review, Concludes November's Decline Was Accurate".
Check to receive email when comments are posted.
  1. Jack Wakshlag from Media Strategy, Research & Analytics, November 4, 2016 at 8:23 p.m.

    Look at the data. It's easy to see where the anomaly lies. It's the absence of a decline in the prior month. The anomaly is caused by that outlier. Last month is the anomaly. This month is back to normal. 

  2. Ed Papazian from Media Dynamics Inc, November 6, 2016 at 6:03 p.m.

    Correct me if I'm wrong, Jack, but aren't the Nielsen cable channel coverage estimates derived from its panel, as opposed to independent data sources? If so, wouldn't these relatively small bounces---or in this case, declines----be explained, in large part, by the fact that they are survey estimates, not a subscriber by subscriber "census"? Of course, overall trends need to be evaluated, but one wonders if month by month data is being taken too literally by the trade press and others.

  3. Jack Wakshlag from Media Strategy, Research & Analytics replied, November 7, 2016 at 2:18 p.m.

    Yes, they are sample based but the sample is much larger and more stable than years ago for these purposes. When looking for outliers and anomalies, it pays to look at the trend.  In this case it's clear to see that the absence of a decline in the prior month is the culprit here. 

  4. Michael Pursel from Pursel Advertising, November 7, 2016 at 4:57 p.m.

    In a Wikileaks drop, they said the Nielsen review was headed by James Comey.

  5. John Grono from GAP Research, November 7, 2016 at 8:32 p.m.

    Ed, the way we do it here in Australia (and we started meters in the '90s with Nielsen) is that an Establishment Survey (ES) 10x the installed sample is conducted prior.   It collects data that is not available via the Census or via other verified third-parties.   For example, cable penetration, devices in the home, internet connection (and speed) etc. etc.   This is generally done on a (weighted) 12-month basis - add a month and drop the same month of the prior year.  Sometimes you get a 'rogue' month which ends up implying that something like, say, internet connection in he home has dropped but there is no evidence of that from the major ISPs.   Such rogue ES months can cause false dips or jumps.

  6. Ed Papazian from Media Dynamics Inc, November 8, 2016 at 6:30 a.m.

    Thanks, John. But what happens if the Establishment Survey findings are significantly different than the rating panel's regarding a cable channel's penetration? Are the nationwide ratings adjusted accordingly?

  7. John Grono from GAP Research, November 8, 2016 at 7:40 p.m.

    Good question Ed.

    The ES precedes the panel.   When you start up a service you use the Census and also conduct a 10x ES to enumerate up viewing variables that MAY affect/correlate with viewing behaviour.   The ES would include things like household structure (bigger houses view more), lifestage (older lifestages view more), technology and devices (the more you have the more you watch but it is fragmented) etc.

    Once the ES and Census are melded you construct a panel composition matrix.   Here in Australia we control on 99 variables - lifestage (which covers HH size, age, presence of children/teens etc.), number of TVs, presence of a PVR, presence of cable - within our five major metropolitan cities (around 2/3 of Australia's population).   We then do the same for the major regional areas in a separate service.

    You then recruit the sample according to those panel controls.   The operator is allowed a +/- 2 percentage points variance.  Happily all cells are within the +/- 2% and 95% of them are within +/- 1%.

    The ES is conducted on a rolling basis., so each quarter the last 12 months are processed and analysed.   This then leads to a review of the panel targets each quarter ... so the panel can never really get out of control.   A quarterly review might mean we need +2 homes in a cell with a compensating -1 home in two other cells ... that sort of thing.   N.B.   The metropolitan panel is currently n=3,500 homes and the regional panel is n=2,015 homes.   These will increase by 50% or the start of 2017.   The current 'headcount' nationally is around 13,000 people a day, which will rise to 20k+ next year.

    So rather than rely purely on weighting to adjust the ratings we adjust the panel continuously in micro-movements.   This means little or no discontinuitues.   Further the more you rely on weighting the ratings become more about mathematical extrapolation than real observed changes in viewer behaviour.   [And for the real nerds - the ES 12-months is calculated putting slightly more weight behind recent data so as to pick up on trends (e.g. increase in internet connected TVs) quicker.

  8. Ed Papazian from Media Dynamics Inc, November 9, 2016 at 7:23 a.m.

    Thanks, again, John. Very interesting system in Australia. I assume that when you say the panel is "adjusted" based on the independent population demo findings, that this entails dropping or adding randomly selected panel members on a periodic basis---quarterly?---to keep it in line, rather than the old stand by---"sample balancing". Is that correct?

  9. John Grono from GAP Research, November 9, 2016 at 6:13 p.m.

    That's correct Ed.   Quarterly review.

    A cell with a surplus has a home/homes dropped either randomly, or maybe a home with a history of non-compliance, or maybe a home that is nearing its maximum time on the panel.

    Conversely, a cell with a deficit is replenished by identifying within the pool of homes contacted when the ES was conducted homes in the same geography, lifestage, number of TVs, presence of DVR and presence of cable.   Those homes are then contacted for recruitment.

    The panel is reviewed daily (validation checks) and the composition is reviewed continuously (cancellations mean additional recruitment so that is an opportunity to 'rebalance') against the current targets.   The targets are reviewed quarterly so there is generally a little more activity each quarter.

  10. Ed Papazian from Media Dynamics Inc, November 9, 2016 at 8:23 p.m.

    Thanks, John. It sounds like an interesting solution to the panel variability problem.

Next story loading loading..