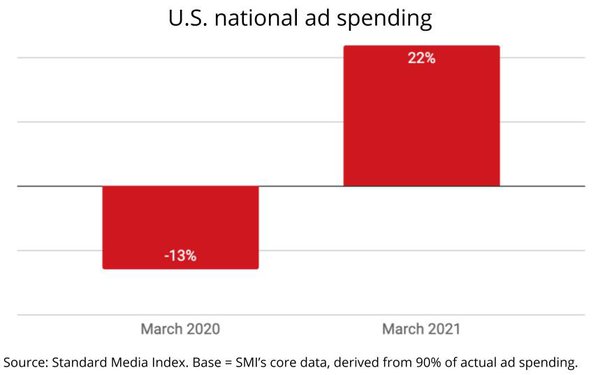
In the first month to reflect a
year-over-year comparison with the beginning of the COVID-19-related ad recession, national ad spending expanded 22% in March vs. the same month last year.
The data, which is derived from
Standard Media Index's core database representing 90% of U.S. national ad spending, is a significant lagging indicator that the U.S. ad industry is back on a firm footing, and then some. March's
22% expansion compares with a 13% contraction in March 2020, which was the first month to reflect U.S. lockdowns related to the COVID-19 pandemic, as well as a rapid halt to ad spending in many ad
categories.
It also compares with a 7% year-over-year increase in national ad spending in March 2019, indicating the U.S. ad industry is now expanding faster than its normalized base (see
below).
While SMI has not yet disclosed March 2021 data for other media, it provided MediaPost with a glimpse of TV ad spending, which shows demand for national TV ad inventory has also
rebounded, though this year's 13% gain does not yet offset March 2020's 17% decline (see bottom). Nonetheless, the finding is a significant signal for TV networks as they begin preparing for the
2021-22 upfront advertising season.
advertisement
advertisement
While prior year data was not available at presstime, SMI's update indicates U.S. digital ad spending expanded 27% in March vs. the same month last
year.

