 While Retail
companies continue to be the biggest spenders in the programmatic space, Consumer Packaged Goods (CPG) companies emerged as the second biggest spenders in Q2 2014, after being the fifth
highest-spending vertical in Q1 2014.
While Retail
companies continue to be the biggest spenders in the programmatic space, Consumer Packaged Goods (CPG) companies emerged as the second biggest spenders in Q2 2014, after being the fifth
highest-spending vertical in Q1 2014.
Retail actually widened its lead as the top spending vertical in programmatic between Q1 and Q2, but CPG has leapfrogged the Financial, Auto and Telecom
industries in terms of programmatic spend. CPG companies spent 53% as much as Retail companies on programmatic last quarter, while Financial (46%), Auto (41%), Telecom (40%) and Travel (34%) rounded
out the “big six” spenders. Business spent 19% as much as Retail, with Media (16%), Entertainment (14%) and Education (8%) rounding out the top 10.
“We’re witnessing a
renaissance among CPG brands in the programmatic space,” stated Andrew Casale, VP of strategy at Casale Media. The data comes from Casale Media’s Q2 2014 Index Quarterly Report.
advertisement
advertisement
A. Casale continued in the statement: “Just a year ago, CPG
brands weren’t even among the top 25 spenders. Today, two of the top 10 spenders are CPG brands. With big players like Mondelez planning to invest nearly half of its marketing budget
in programmatic, it is really just a matter of time until we see more CPG brands rise on the list.”
Kellogg’s was the other CPG company to crack the top 10, while Verizon overtook
both Target and AT&T as the highest-spending brand in programmatic in Q2 2014. AT&T, which was the highest-spender in Q1, is now fourth behind Verizon, Target and Comcast, respectively. Gap,
Sears, American Express and the aforementioned duo of Kellogg’s and Mondelez were the newcomers on the top 10 list in Q2.
While some parts of the programmatic industry remain in flux,
such as who is spending money, other areas, such as where that money is being spent, are starting to mature.
Casale found that the top three demand-side platforms (DSPs) by marketshare
accounted for 51% of the programmatic spend in Q2 2014, up 3% from Q1. “The overall distribution of shaw among the top 10 DSPs remains similar, however, and has gone largely unchanged over the
last five quarters,” Casale writes in its report. “This stability suggests that the DSP category is moving toward a state of competitive maturity among top players.”
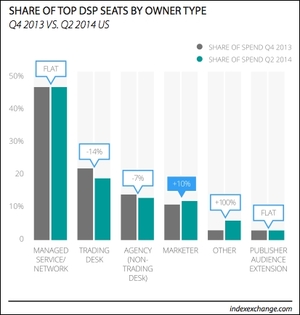
Marketers
occupied 12% of the “seats” on DSPs in Q2, up from 11% in Q1. On the other hand, trading desks saw their “seats” decrease by 14% while agencies saw their representation on DSPs
drop by 7%, per the report.
The report also reveals that there was much more competition in the RTB marketplace in Q2 compared to Q1. Casale says bid density -- the number of bids per
impression -- was up 28% quarter-over-quarter. The average clear price grew by 14% quarter-over-quarter.