Netflix Streaming Success Not Just From Top Shows: Analyst

Premium streaming financial success requires a lot of different kind of TV/movie content -- not just a top-ten list or the most-viewed shows, according to one media-company focused stock-market research analyst.

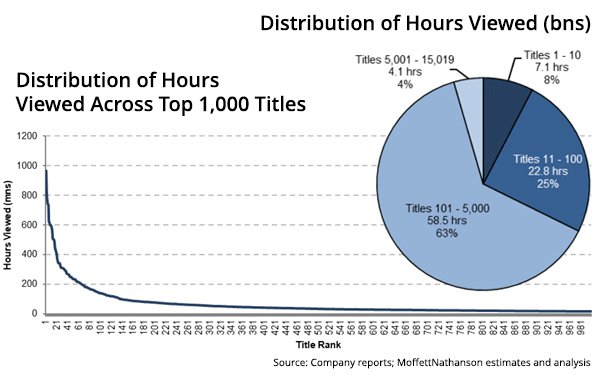
Looking at Netflix, the dominant and consistently profitable premium streamer, MoffettNathanson Research says “63% [two-thirds] of viewership was driven by titles neither in the top 100 nor in the bottom 10,000.”

This analysis comes in response to Netflix's six-month research release last week, in which it said 99% of all viewing came from 18,000 titles, with nearly 100 billion hours viewed.

MoffettNathanson adds that 10 titles drove 8% of all viewership in the first half of 2023, and 100 titles drove 33%. “But we were more struck with the relative diffuseness of the rest of the platform... This more or less confirms what we saw in Nielsen’s U.S.-specific data: Streaming requires a lot of content.”

advertisement

advertisement

MoffettNathanson went on to calculate that in the first half of 2023, a total of 93.46 million total hours were viewed --  from 242 million global subscribers. That means the average Netflix subscriber is watching about 2.1 hours of programming per day.

All this helps streamers conquer the dreaded problem of "churn" -- the process where subscribers depart a streamer platform, perhaps signing back on later on when their favorite TV shows start up again.

“While the average American household may have once watched TV eight hours a day, capturing more than two hours of every subscribing household’s day is likely enough value delivered to minimize churn.”

 
2 comments about "Netflix Streaming Success Not Just From Top Shows: Analyst".
Check to receive email when comments are posted.
  1. John Grono from GAP Research, December 18, 2023 at 6:39 p.m.

    Very interesting Wayne.

    There is another way ti interpret that data.

    For example the 1-10 Titles racked up 7,1 billion hours.   That means that the average 1-10 Title racks up 710 million hours.   Very impressive.   Here is the table of the average hours per Title Band.

    * The 1-10 Titles average 710 million hours
    * The 11-100 Titles average 253.3 million hours
    * The 101-500 Titles average 11.9 million hours
    * The 501-15,019 Titles average 0.4 million hours

    Now the ranking for average hours per individual titles are:
    * 1-10 Title's average hours - 72.8%
    * 11-100 Title's average hours - 26.0%
    * 101-500 Title's average hours - 1.2%
    * 501 - 15,019 Title's average hours - 0.0%

    Same data viewed in a different way.   Quite different stories.

  2. Ed Papazian from Media Dynamics Inc, December 19, 2023 at 11:09 a.m.

    Wayne, if the average Netflix "subscriber" is viewing 2.1 hours of Netflix content per day---as stated by the analyst---that implies that Netflix, somehow, knows who in each household is watching whenever its content is on-screen. But that can't be. In reality, all that Netflix knows is that a device was activated and that one of its shows---or movies---was played on that screen for a certain number of minutes. If an average viewer-per-set figure was applied---say about 1.2 - 1.4 viewers-per-set---which is slightly higher than the linear TV norm---and an average Netflix home had 2.7-2.8 residents---also slightly above the norm----then the average resident in a Netflix home watched only 45-50% of the time---or about one hour of Netflix content per day--- not 2.1 hours. Once again, this seems like a case of confusing set usage with viewing. You can't have the latter withour the former---but except for single resident households, the two metrics do not have a one for one relationship.

Next story loading loading..