

Commentary
The Infographic Of You: Foursquare Visualizes Your Check-Ins
- by Steve Smith , Staff Writer @popeyesm, June 14, 2013
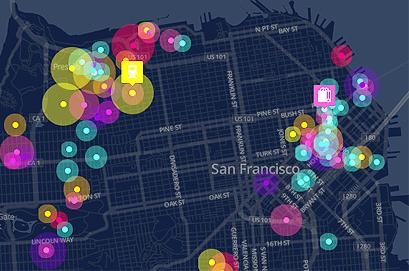
After all those years of griping about the slavish silliness of the check-in behavior that apps like Foursquare were trying to cultivate in us, for a second there I wished I had checked in more often over the years. Apparently, I am such a social slacker that I can’t even register on the new Foursquare Time Machine tool that visualizes for you your history of check-ins. The imaginative and well-executed thingamabob is sponsored by Samsung Galaxy S4, and really is an ad that ultimately leads to recommendations for nearby places to visit.
The page turns your check-in history into both an infographic and an animated journey that moves you point to point across your past Foursquare activity. The personalized infographic titled “Oh the places I’ve gone” breaks down your check-ins by location type, distance traveled, share of work vs. play, patterns of usage like most common afternoon spot and frequent connections between spots.
It is a tremendous piece of sponsored content that leverages the Foursquare experience with the Samsung product theme.
But more importantly, it demonstrates one of the ideas I took from Mary Meeker’s D11 presentation weeks ago. As personal devices and wearable computers cast off ever more data about our own behaviors, one of the real opportunities is for media companies and marketers to productize the data in interesting, life-improving, and just entertaining ways for consumers.
At OMMA Video Europe in London earlier this week, mobile marketing
agency Fetch’s Managing Director James Connelly made an important point about how we think about mobile video. He reminded us how mobile is not just a platform for video viewing, but a two-way
channel of video content. Marketers need to think about how they find a place in that bi-directional flow, and not just treat it as another screen for content. Likewise, marketers have to think of
devices as devices.
Every interaction a user has with that device is capable of rendering (with permission, of course) data that can be used in creative ways. In other words, we
aren’t targeting “eyeballs” here. You are accessing people’s fingers, movements, contexts. All of these things can build the content that users are invested in because they can
see themselves in it. Mobile gives the most creative minds in the industry the opportunity to create experiences with people -- not just paint with pixels.
Although, I guess, all of those experiences won’t be available on your own phone. In a crushing irony, the inspired Time Machine project is not (wait for it) optimized for mobile. The site instructs visitors on their mobile browser to use the desktop. Really? From both a mobile-first app brand and the world’s leading mobile phone provider? You’re breaking my heart here.


Steve Smith is Editorial Director of Events for MediaPost
Mickey MacManus, author of Trillions tells us that the future of innovation will be found in capturing and monetizing this digital exhaust. In order to do this right we must determine the currency of personal information.