
January 25, 2023

Sagging Broadcast Demand Drags National TV Ad Costs Down In January, Cable Continues To Build
- by Joe Mandese @mp_joemandese, March 8, 2016
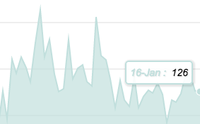
National TV ad prices fell slightly coming into the new year after ending 2015 on a down note. Prices fell one point to an index of 126 in January, continuing a downward trend that began when December 2015 crashed 17 points from an index of 144 in November 2015, according to the Real Cost Index, a collaboration of MediaPost and SQAD enabling readers to track the supply and demand of national TV advertising time based on cost indexing.
On a year-over-year basis, January’s TV advertising costs are up five points from a 121 in January 2015.
January’s TV price index compares to a 12-month high of a 206 in March 2015 and a 12-month low of a 93 in June 2015.
Demand for national cable TV appears to be stronger relative to national broadcast advertising inventory, as cable’s ad costs rose a point to a 149 in January vs. a 148 in December 2015, and is up five points from a 144 in January 2015.
The national broadcast TV ad index slid seven points to a 128 in January vs. a 135 in December 2015, though it is off only two points from a 130 in January 2015.advertisement
advertisement
4 comments about "Sagging Broadcast Demand Drags National TV Ad Costs Down In January, Cable Continues To Build".
Read more comments >
Next story loading 
Ed please comment. btw your Drone with the Comp report is Missing in Action.
Does anyone know if this report uses the Gregorian month of January or the standard broadcast month? I mention it because the broadcast month of January had five weeks in it this year compared to four weeks last year.
Joe, if I understand the numbers, they are based on estimates of the average time cost per 30-second commercial. If that is correct, one can interpret the findings in a number of ways. For example, say that the average cost of a primetime broadcast network commercial in January 2015 was $100,000 and it dropped to $99,000 this past January. That might be interpreted as showing a slight softening of advertiser interest. However, let's also say that the average primetime 18-49 rating was 3.1 in January 2015 and it dropped 8%, to 2.9, in 2016. If we calculate the cost- per-rating point ( CPP )---a surrogate for audience---- the 2015 figure would be $3226 while the 2016 CPP works out to $3536. Wouldn't that be an indication that advertiser demand had risen---as they are paying more per unit of audience?If I have misunderstood your index please let me know.
Ed paying more $$$ for less audience is NOT an indication advertiser demand had risen, which is the same for payTV bundles that keep going up in price in the face declining payTV subs- no that does not mean more demand.