At about the time big agencies and advertisers were wrapping up their upfront ad deals for the 2016-17 season, near-term demand for national TV advertising
time was inching up, according to the most recent monthly data from the RealCost Index, a collaboration of MediaPost and SQAD indexing the average cost of national TV advertising time.
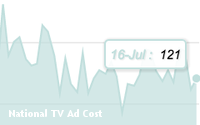
In July, the national TV cost index climbed to 121, up nine points from June, which began a typical downward demand cycle heading into the summer months.
More
significantly, the index rose four points over July 2015, showing some year-over-year momentum. According to historical data, July 2016 generated the highest national TV prices since July 2013, when
he index stood at 126.
advertisement
advertisement
Demand seems to have been relatively strong for both broadcast and cable networks during this period.
The index for broadcast network ad
prices rose six points to a 139 in July, while cable’s also rose six points to a 140 for the month.
However, on a year-over-year basis, the average price of broadcast network inventory
fell 14 points from an index of 153 in July 2015, while cable’s actually rose four points from a 136 in July 2015.