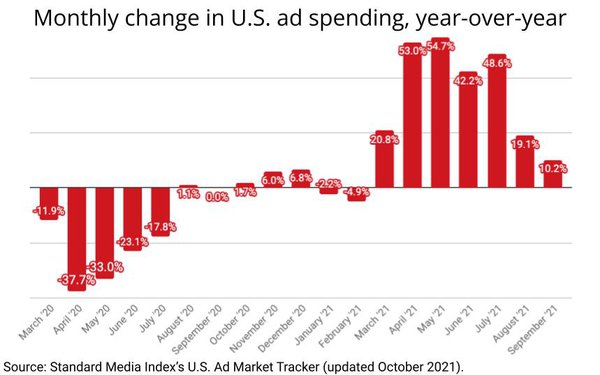
U.S. ad spending rose 10.2% in September vs.
the same month a year ago, according to a MediaPost analysis of an updated composite of actual ad spending from the major agency holding companies. The composite, an updated version of the U.S. Ad Market Tracker launched in partnership with Standard Media Index in
2015, represents a more comprehensive pool of data contributed by all of the holding companies and was necessary to provide a more accurate view of the marketplace.
“The
initial index was a custom model that prioritized trending back to 2009, but in that time the model had fallen out of sync” with SMI’s total pool of ad spending data, explains Rick Bruner,
head of insights and analytics at SMI, noting that the current pool includes all six of the major agency holding companies, as well as “many of the largest independent agencies.”
advertisement
advertisement
SMI estimates its current pool represents about 95% of national brand advertiser spending, though it doesn’t represent total U.S. ad spending, much of which is bought by the long-tail of
small advertisers and agencies buying local and/or direct digital media from big platforms like Google, Facebook, etc.
The updated U.S. Ad Market Tracker is a composite index with a
baseline set to the average month in 2017. The source line in the index provides more detail of the media represented in the index, but it is arguably the best current view of actual spending in the
U.S. advertising marketplace, and as such is a vital tool for tracking month-to-month, year-over-year and longitudinal growth in the supply and demand of the U.S. advertising marketplace.
“We at SMI feel it is our duty to the industry, as this stewards of this immensely valuable data set, to share this intelligence for the betterment of industry health with transparency
on industry trends and pricing norms,” explains Bruner, adding that future collaborations will include some explicit ad price market intelligence, which will be published in the months to
come.
Some additional new features of the rebooted composite include one showing the side-by-side index values and growth of digital vs. traditional media.
Based on
the current monthly data, digital now comprises 57% of total spending, up from 48% in September 2020, and just 38% in September 2017, the first of those months represented in the new index.
In terms of explicit growth this month, SMI notes that digital ad expenditures grew 29% year-over-year, while traditional media fell 9% during the same period.
Meanwhile,
MediaPost’s analysis of the rebooted market composite data shows there was zero growth in total U.S. ad spending between September 2019 and September 2020, one of the first to emerge from the
COVID-19-related ad recession that began in the spring of 2020.
To view the explicit impact of the recession, MediaPost has revised the month-to-month change in the index's value going back to
March 2019 (see chart above).
Interestingly, smaller ad categories -- not the biggest ones -- have been accelerating much of the overall ad marketplaces growth. While the top 10 ad
categories grew only 1.7% year-over-year in September, all others expanded 23.4%. Compared with September 2019, the top 10 grew 6.3%, while all others expanded 15.9%.
In terms of
specific media highlights, SMI notes that out-of-home media spending grew 69% year-over-year in September, “fueled by billboard, point-of-care (ie. doctor’s offices), retail and
events.”
“TV is down 13%, driven heavily by post-season NBA programming,” SMI said of its own analysis, explaining, “NBA post-season, along with NHL, were
delayed until September last year, but course corrected to summer this year. The presidential election of 2020 also drove news inventory up in last year’s September compared to this
year’s.”