As more and more streaming platforms
compete for users’ time, operators are struggling to differentiate their offerings, crack the content discovery code and keep consumers tuned in.
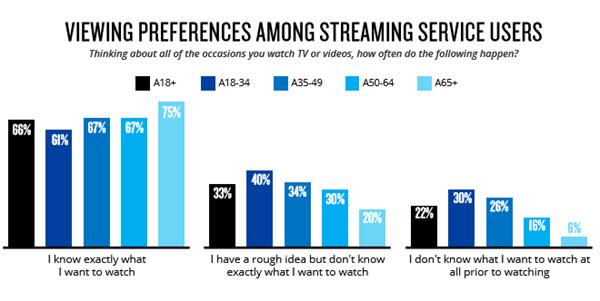
Nielsen’s just-released Q1
2019 Total Audience Report finds that 66% of streaming platform users as a whole know “exactly” what they want to watch when they tune in. The percentages agreeing with that rise with age,
peaking at 75% among those 65 and older.
When they’re not sure what they want to watch, 58% say that default to their favorite channels, and 44% scan through channels. Only a third
say that they browse their SVOD content menus, and just 24% watch recommendations from a service’s guide or menu.
Nearly a quarter (21%) say that if they can’t decide what to
watch, they simply go do something else.
advertisement
advertisement

Conclusions: Programmers need to work harder to dislodge
ingrained habits, “spur viewing disloyalty a little more,” and improve the accuracy of their recommendations.
The data also confirm that they have a short window to
accomplish this.
On average, U.S. adults spend 7.4 minutes browsing when they’re not sure what they want to watch. That rises to 9.4 minutes among those 18 to 34 — reflecting
that 30% of this age group go in with no idea what they want to watch, and 40% with only a rough idea. Those 35 to 49 also exceed average browsing time, at 8.4 minutes. But older age groups have less
patience, giving up after about five minutes.
Video Use Down A Bit Vs. Q1 2018
On average, U.S. Adults now spend 11 hours and 27 minutes per day consuming media
across TV, TV-connected devices, radio, computers, smartphones and tablets — up by a full 21 minutes versus Q1 2018.
Live TV accounts for 3:53 minutes, time-shifted TV for 34
minutes, and use of apps or the web on smartphones 3:01 minutes (up from 2:22 in Q1 2018).
Overall video use — time spent with a TV set, video on a computer, or and using video focused
app/web on smartphones and tablets — clocked in at five hours and 46 minutes per day.
While that’s an 11-minute decline from the year-ago quarter, Nielsen points out that Q1
2018 viewership levels were elevated by the Winter Olympics.
Video viewing through TV-connected devices rose by eight minutes per day, on average, driven in part by the ongoing replacement of
old TV sets with ones pre-loaded with connected options, says Nielsen.
Seven in 10 homes now have a subscription video on demand (SVOD) service, and 72% use streaming-capable TV devices.
Also, as of June, virtual multichannel video programming distributors (vMVPDS) exist in 5.3% of all U.S. TV households.
Digging into demographics, Asian American adults spend 42 minutes
per day on Internet-connected devices, and black adults spend more than an hour per day using TV-connected devices.
Video consumption on smartphones and tablets also increased — by
five minutes per day, on average.
Adults 18-34 spend more than half of their daily media usage with digital media, such as computers, smartphones, and tablets.
Also, half
of all adults stream audio through their smartphones each week, and 28% of U.S. households own a smart speaker.