While current U.S. video streaming services subscribers are quite
price-sensitive, they’re also willing to spend considerably more than they’re currently paying, according to new research from KPMG.
On average, subscribers are paying $22 per
month for those services — and they’re willing to pay up to $11, or 50%, more.
And next to price, being ad-free is the most-cited factor in determining how consumers pick streaming
services.
KPMG conducted two web-based surveys about the factors that drive choices of streaming services among U.S. consumers who confirmed that they have access to at least one video
streaming service (selection methodology, projectability and margins of error not stated in report). The surveys, concluded October 3, yielded 1,025 responses from consumers aged 15 to 60, and 1,030
from those aged 18 to 24.
advertisement
advertisement
Just under 70% of the younger group and nearly 80% of the older group are currently paying somewhere between $10 and $40 per month for streaming subscriptions.
The $11 to $20 range is most common, cited by 39% of the older group and 28% of the younger group. Fully 21% of the younger respondents who have access to at least one service report not paying
anything for content, versus just 4% of the older group.
Asked how much more they’re willing to pay to add more services, 44% of the older group and 38% of the younger group said between
$1 and $10; 23% of the older and 21% of the younger groups said between $11 and $20; and about 10% of each group said between $21 and $30.
However, under 10% of each group would pay in excess
of $30 more — and fully 24% of the younger group and 16% of the older group said they wouldn’t be willing to pay any more to add more services.
In fact, price is the dominant
factor in picking a streaming service, cited by 67% of the older group and 52% of the younger group.
(Respondents were asked “What features are most important to you when choosing a
video streaming service?,” but instructed to check all that apply.)
Being ad-free was chosen by 37% and 47% of the older/younger groups, while being ad-based for a reduced fee was chosen
by 9% and 11% of those groups, respectively.
“Younger consumers prefer an ad-free environment, but re willing to sit through ads to reduce cost,” sums up the report.
Content (“Content is most important; others are secondary”) was chosen by 48% and 36% of the older/young groups, respectively.
All consumers want access to a broad content mix
including original series and a substantial library of movies/TV series, notes KPMG. For younger consumers, in addition to price, the mix of content and topics, as well as a continuous supply of video
content, are important factors.
Other important factors: Ease of access to the service (40% older/33% younger); portability to multiple devices (33%/31%); ability to download content
(24%/21%); accuracte recommendation engine (13%/15%); an ability to rent content beyond subscriptions (11% each).
Three-quarters (64%) of each age group report having access to two to three
streaming services (whether or not they’re the primary subscriber), with slightly more of the younger group reporting access to only one service (22% versus 18% for the older group).
Among primary subscribers, 54% of the younger group and 59% of the older group report subscribing to two to three services and 36% and 26%, respectively, report subscribing to one service.
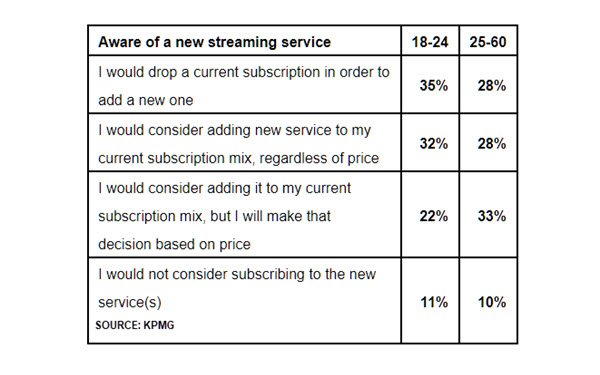
When it comes to adding a new service, both groups were fairly evenly distributed in terms of saying they would drop a current service to ad the new one, saying that they would add a new one
regardless of the price, and saying that they would consider adding one, but make the decision based on price. (See table above.)
Not surprisingly, devices of choice for streaming vary
somewhat by age.
Asked which device they used most often for streaming, 65% of the older group cited television (defined as including smart TVs and connected devices like Roku an Apple TV),
and 41% of the younger group cited smartphones (versus 15% of their elders). Still, nearly a third (30%) of the younger group reports using TV most frequently.
Laptops/computers are most
frequently used by 18% and 10% of the younger/older groups, respectively, and gaming devices by 6% and 3%, respectively.
The report summary can be downloaded at no charge.