
Although total playtime and number of
plays continued to increase across video-on-demand (VOD) and online linear TV in this year’s first half, intensifying competition drove an accelerated decline in user engagement on the
individual service level.
But there was one big exception: sports programming.
And while average number of titles consumed is declining, viewing times are increasing,
pointing to consumption of longer content.
Those are the main takeaways from the latest global video streaming industry report from video analytics solutions provider NPAW, based on data extracted from its platform in 2022’s first six
months.
“Attracting and retaining users is becoming increasingly challenging as competition between services and global economic uncertainty grow,” sums up NPAW CEO and
Co-founder Ferran G. Vilaró. “The rise of advertising-based models and the promise of sports streaming both have the potential to deliver further industry growth, but long-term success
depends on a more fundamental formula: superior content plus a superior experience.”
advertisement
advertisement
After three quarters of year-over-year decline — including a 9% decrease in full-year
2021 — VOD services globally saw daily playtime per user and service decline again in this year’s first half — this time by 11%. This suggests that the decline in consumption may be
speeding up.
In North America, average playtime per user per service declined from 90 minutes to 75 minutes. (Chart top of page.)
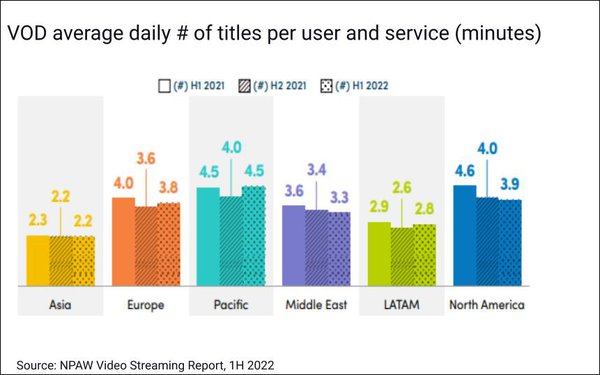
Viewers also watched slightly fewer VOD titles
per day than a year before. On a global level, the average was about three titles per day and service — down 4% versus the year-ago period.
The Pacific was the only region to
recover first-half 2021 levels, overtaking North America as the area where users watch the most titles per day (four versus three). Asia remained the region with the lowest average.
Despite the global decrease in average daily
number of titles, global average media duration (average length of titles watched) has been on the upswing. In 1H 2021, it rose to 33.9 minutes — up 6% year-over-year.
North
America, while logging its fourth consecutive quarter as the leading region by average media duration or title view time, saw its average decline from 41.8 minutes to 40.6 minutes.
The
global average completion rate for VOD rose 2% in the first half, driven by North America and Latin America.
Average bitrate for VoD approached a peak, as providers increased average
join time to control buffering. This resulted in a rise in exit before video start (EBVS), which had decreased in 2021.
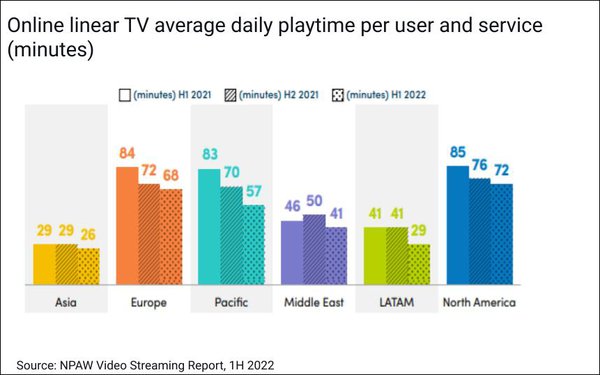
Meanwhile, in online linear TV, average daily playtime per user and
service, while up for full-year 2021, has been decreasing for the past three halves.
In 1H 2021, it dropped by 18% globally. In North America, daily playtime declined from 76 minutes to 72
minutes.
“This suggests that online linear TV providers, like VOD platforms, are feeling the effects of increased competition,” notes the report.
Online linear users are not only spending less
time on each service; they are also watching linear content for shorter periods at a time.
After a 3% increase in full-year 2021, global average effective playtime — how long a user
watches content each time they hit play — dipped slightly (by 1% YoY) in 1H 2022. For online linear TV, this metric is a good indicator of length of viewing sessions.
As for
sports, in a six-month period packed with major events,
Global average daily consumption per user and service rose 12% YoY in VOD (to 34.5 minutes) and 13% in online linear (to 86.9
minutes).
Linear sports content’s average was nearly double that of generic linear content, confirming sports content’s engagement power.