A
new, two-part report from Parse.ly, an analytics and content optimization platform for digital publishers, analyzed the top 14 referral sources of traffic to publishers’ content, determining
which platforms audiences are using to consume editorial.
The report reveals that referrers neither search nor social — categorized as “Other” in Currents
— grew 21% year-over-year, making it the fastest-changing category that sends traffic to publishers’ content.
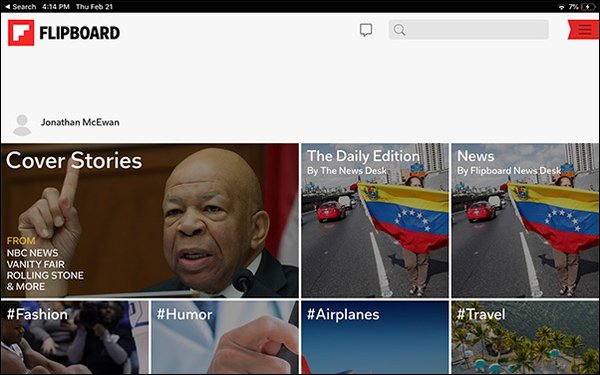
That includes news aggregate apps like SmartNews and Flipboard.
The data comes from Currents, the internet attention-measuring platform Parse.ly launched last
fall to give publishers the ability to measure how audiences spend time consuming content online.
advertisement
advertisement
The first part of the Parse.ly report looked at how traffic from
each referral source has grown or shrunk year-over-year, and the second part breaks down each referrer by individual attributes, such as word count, device views and popular categories read on
each.
“On any given week in 2018, internal referrals, meaning someone that came to a second (or third or 30th) page within your site, comprised over 35% of traffic,” according to a
blog post on the report from Parse.ly senior data analyst Kelsey Arendt.
“People who come to sites do keep reading,” she continued. “Internal referrals drove more
traffic than direct referrals, and more than any external referrals (search, social, or other).”
Social referrers, such as Facebook and Twitter, were up 9%
year-over-year, largely thanks to Facebook.
Facebook traffic is up 14% this year, Instagram is up 4% year-over-year.
From January to April, Twitter referrals dropped 11%. LinkedIn was down
14% year-over-year, while search referrers were down an average of about 4%.
According to data pulled by Currents, “there are more views to articles about Twitter than views from
people find articles and stories on Twitter,” Arendt wrote.
In part two of the
report, Arendt writes that the median length of articles published from November 2018 to January 2019 has a word count of 529, with a lower quartile of 261 words and an upper quartile of 998
words.
Most content ranges between about 200-600 words.
The platforms where short text posts do best include Pinterest, Facebook, Instagram, SmartNews and both Yahoo Search and Yahoo
referrals.
Linkedin, Reddit (not the app) and the Drudge Report refer more traffic to long-form posts, or those over 1,000 words.
Mobile traffic grew 25% during 2018.
The apps
that had the most growth last year — including SmartNews, Flipboard, Instagram and Google — also tend to have most, if not all, of their audience on mobile.
“The desktop
experience is not dead!” Arendt noted.
Desktop had “much higher rates with direct and internal traffic referrals,” according to Parse.ly’s data. Desktop referral
traffic could come from a link in an email or chat apps. Desktop traffic also corresponds slightly more to business content and long-reads.
From November 2018 to January 2019, the Law,
Government & Politics content category topped most of the referral sources for popularity. In general, it is the most-read category of content, according to Parse.ly’s data, which tracks 1
million news stories daily.
The three exceptions to this include Pinterest (Food & Drink), Instagram (Style & Fashion), and LinkedIn (Business).
Google Search and Twitter both
have Sports as their second most popular category.