The habit of checking messages, texting
and even watching videos on phones, while also watching TV, is even more pervasive than some might guess.
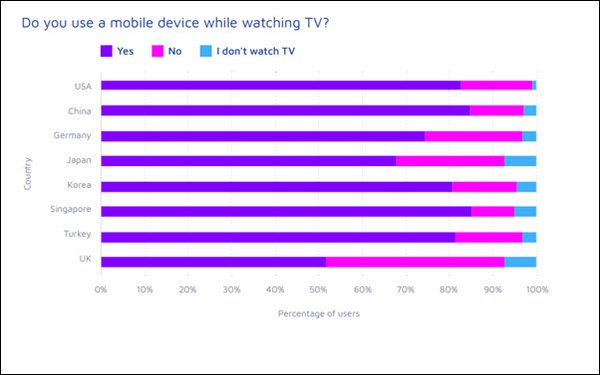
A recent survey of smartphone users 16 and older across eight
countries — the U.S., U.K., Germany, Turkey, Japan, Singapore, Korea, and China — found 76%, on average, reported second-screening.
In the U.S. alone, the number jumps
to 83% — although Singapore and China have us beat, with both at 85%, according to the research, conducted in November by global app marketing analytics platform Adjust.
This
translates to a huge universe of consumers who can potentially be marketed to through use of phone-scannable QSR codes or other engagement methods — like downloading a mobile app in TV
content… particularly CTV and addressable TV.
advertisement
advertisement
To leverage the second-screen marketing opportunity, marketers need cross-device measurement to properly attribute which channels
result in the greatest mobile response, so they can adjust spend accordingly going forward, of course.
But some intriguing insights can be gleaned about second-screen behavior and user
segments from the Adjust survey.
For example, among all countries studied, social apps are the number one choice for second-screeners — favored by 65.4% of respondents, on average
— followed by banking (54.9%) and gaming (44.9%).
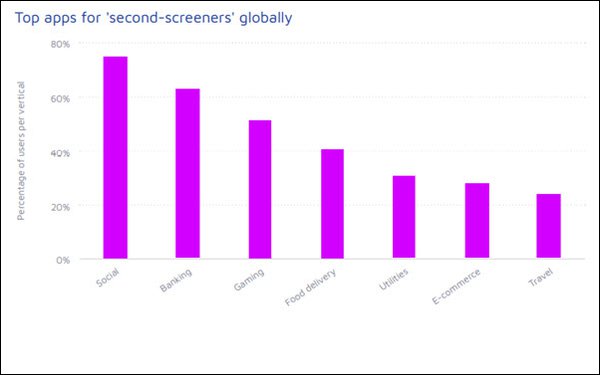
Food delivery apps are strongest in China (65.2%), Korea (36.6%) and
Singapore (48.2%).
Here are the most popular types of apps among U.S. second-screeners:
Social apps | 77.9% |
Banking apps | 51.4 |
Gaming apps | 51.1 |
Food delivery apps | 28.2 |
Utilities apps | 23.3 |
Ecommerce apps | 20.9 |
Travel apps | 18.5 |
None of the
above | 4.3 |
U.S. second-screeners ages 16 to 24 are the demo most inclined to use social (86.9%), gaming (73.7%) and
food delivery (39.4%) apps; those 35 to 44 are most inclined to use banking (59.7%) and ecommerce (30.9%) apps; and those 55 and older are most inclined to use travel apps (30.9%).
And while
these tidbits aren’t necessarily tied to second-screening, here are U.S. smartphone users’ favorite streaming services:
Netflix | 61.3% |
Amazon Prime | 41.8 |
Hulu | 30.0 |
Disney | 20.0 |
Don't have favorite streaming/TV service | 15.5 |
YouTube TV | 11.5 |
HBO | 7.9 |
Peacock | 6.2 |
Other, please specify | 5.5 |
Apple TV+ | 3.0 |
ESPN+ | 2.5 |
Crunchyroll | 2.4 |
Vudu | 1.6 |
Another tidbit: Asked which streaming services they “can’t live without,” 65% of the 215 U.S. smartphone users who responded to that open-ended question cited
Netflix, 14% Amazon Prime Video, 10% Hulu, 4% Spotify, 3% Disney+, 3% YouTube, and 34% cited various “other” services.