
While some consumers are consolidating their
streaming services, as of now, U.S. consumers are using more TV “sources” than ever, according to the latest annual Best Bundle study from Hub Entertainment Research.
The
average U.S. TV viewer now uses 5.7 TV sources, defined as inclusive of traditional pay-TV services (cable, satellite, telco), virtual MVPDs, individual SVODs, individual AVODs, antenna TV and
transactional services.
The number has jumped by nearly one full service since just last year, when it was at 4.8. And it’s nearly doubled since 2018,
when it was 3.0. (In 2019, it was 3.7.)
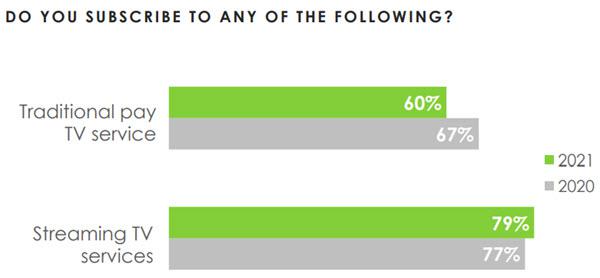
The study — conducted among 1,600 U.S. consumers ages 16-74 who watch a minimum of one hour of TV per week — also finds 79% of TV consumers
now using at least one streaming service.
advertisement
advertisement
That’s up only 2 points from the early pandemic days of 2020, when last year’s survey was conducted. But it’s fully 19 points
higher than the percentage of those using a traditional pay-TV service (60%). And the pay-TV user percentage is 7 points lower than it was in 2020.
Further, the number who report using three or more of the top five paid
streaming services (Netflix, Amazon Prime Video, Hulu, Disney+ and HBO Max) has leapt significantly since last year’s survey: from 28% to 40%, while the number using none of these has declined
by 2 points. (HBO Max wasn't yet launched when the 2020 survey was taken.)
Overall, the number using two or more of the top SVODs has risen 8 points, to 59%. 
Another reason for the jump in the number of sources: The percentage using a free, ad-supported TV
service is also up 8 points since last year, to 48%.
But using an array of sources isn’t necessarily a highly satisfying experience: 52% of all TV consumers
say their current combination meets their needs “very well,” 42% “somewhat well” and 6% “not well at all.”
The “very
well” percentage does rise along with the number of sources used, but even at eight-plus sources, it only reaches 63%.
It would seem inevitable that the combination of consumers resuming out-of-home activities, the
availability of more free services, and still-tight financial circumstances for many will result in some falloff in the growth of SVODs. In fact, Disney+, as well as Netflix, saw subscriber
growth slow in Q1.
However, that doesn’t necessarily mean a slowdown in overall streamlining of TV sources: 21% of this survey’s participants said they plan to add new
“services” (meaning sources, free or paid) in the next six months.
Among all of those who plan to add, 72% say they’ll add without cutting any they
have currently — although those who currently have one to three services are far more inclined to replace an existing service than those who currently have four or more services (43% versus
22%).
