

Commentary
Streaming Services Lost Time-Per-User In 2021 Due To Heightened Competition
- by Karlene Lukovitz @KLmarketdaily, March 21, 2022
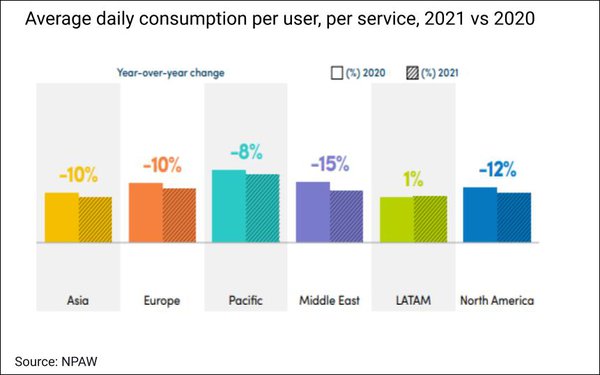
Although total per-household time spent streaming rose last year, increased fragmentation across a larger number of services caused individual services in nearly every global market to lose time-spent per-person, according to a report from video analytics company NPAW.
Average daily consumption per user (chart above) declined by 12% year-over-year in North America, 15% in the Middle East, 10% in Europe and Asia and 8% in the Pacific. Only Latin America saw a small increase: 1%.
Engagement time did pick up in all regions during the second half of 2021 — although it’s too early to say whether this will continue in 2022.

NPAW gathered the data through its analytics suite from January 1 to December 31, 2021. Insights were divided by content type (video-on-demand and linear TV), regions and devices, with key metrics showing general trends in consumption and streaming quality. NPAW also surveyed 110 industry executives about key trends.
Asked if they think that the 2021 trend to more streaming users but less time per service is here to stay, 26.5% of industry executives deemed that likely and 11% very likely; 29.2% said it is not very likely or not at all likely; and 33.6% were undecided.
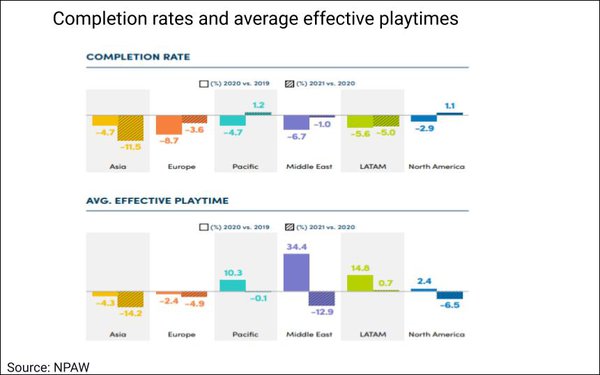
NPAW also found completion rate per play continuing to decline in all regions except the Pacific and North America. Average effective playtime was flat or down across regions — which tends to indicate switching caused by dissatisfaction with content.
Quality-wise, average bitrate across the regions increased by 11.1% year-over-year, compared to an improvement of just 3.2% in 2020 versus 2019. North America and the Middle East saw more moderate gains, reflecting that their bitrates were already high and approaching target levels.
Buffer ratio time dropped by 22.4% on a global level, compared to a decline of 15.6% between 2019 and 2020.
However, improvement in those areas is often associated with longer start times for videos. Start time (or join time) rose 5% on average across regions (and 1.3% in North America) after declining by 8.8% between 2019 and 2020.
Increases in start time eventually lead to losing users, so streaming services will need to balance bitrate, start time and buffer ration “much more subtly to find the sweet spot,” says NPAW.
In the Pacific region, where join times were reduced by 21%and 25% YoY over the past two years, exits before video starts (EBVS) declined by 29% and nearly 33%, respectively.
The report predicts that the quality of sports streaming will continue to rise in 2022 as providers put more focus on it, in line with growing consumption.
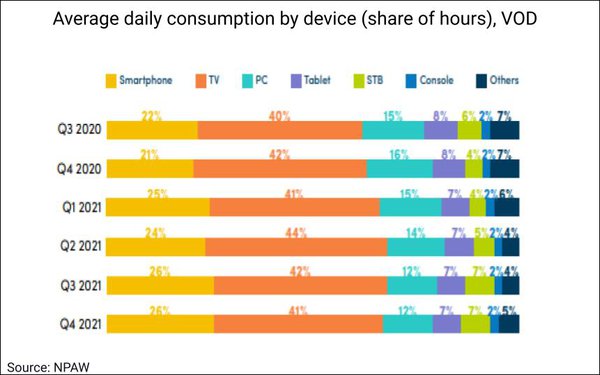
Device-wise, shares of VOD consumption time have remained been fairly stable in recent quarters, with larger screens continuing to dominate.
The TV screen still reigns, with an average share of VOD consumption hours of 41% as of Q4 2021. Smartphones had a 26% share, PCs 12%, tablets and set-top boxes 7% each, and gaming consoles 2%. 51% of households expect to own a smart TV by 2026.
For comparison, looking at linear TV data, average daily playtime/consumption rose 3% on average, but varied widely by region. Latin America and Asia saw 13% and 10% gains, respectively, and the North America and the Pacific saw gains of 3% and 2%, respectively. However, the Middle East had a 14% decline, and Europe a 6% decline.
Linear TV’s consumption is much more dependent on local preferences and trends than video-on-demand, notes the report.
Linear quality and the metrics associated with it have by and large reached stability.


Karlene Lukovitz is editor of MediaPost's "Digital News Daily" and writes the weekly "Video Insider" and "Advanced TV Insider" columns. You can reach her at karlene@mediapost.com.