Modest Rises In National TV Spend, Digital Soars

Perhaps fueling evidence for a healthier upfront advertising market, national TV scatter advertising revenues continue to see decent gains in April -- at high-single digit percentages.

Standard Media Index, which culls 80% of national U.S. media spend from five of six media agencies, said scatter advertising revenue rose 8% in April -- 13% for cable networks and 1% for broadcast networks. This follows national TV’s March scatter revenue results which improved 11%.

Looking at scatter and upfront dollars from deals made in 2015, national TV advertisers spent 6% more revenue in April versus a year ago. Broadcast networks grabbed 7% more revenue from upfront deals; cable networks took in 10% more in upfront revenue. All national TV upfront revenues in April are up 9%.

SMI says this is “promising sign for both cable and broadcast networks even as TV viewership continues to slide.”

advertisement

advertisement

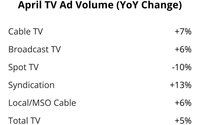
Total television -- national TV, spot TV, syndication and local cable -- climbed 5% in revenue in April versus a year before.

Overall, U.S. media revenues rose 7% in the month -- with digital media revenues continuing to be the best performer, up 15% over the same month a year ago. Three key digital areas continue to soar -- social media, 59% higher; video, 31% more; and digital ad networks/exchanges, 26%.

Out of home was also a big performer -- gaining 12% in the month. Down-trending media segments: magazines, 5% lower; newspapers, falling 15%; and radio slipping 1%.

Best performing advertiser categories were quick serve restaurants (up 44%); prescription pharmaceuticals (34% higher) and automotive vehicles and dealerships (adding 22%).

4 comments about "Modest Rises In National TV Spend, Digital Soars".
Check to receive email when comments are posted.
  1. Ed Papazian from Media Dynamics Inc, May 18, 2016 at 10:38 a.m.

    Wayne, I think when referring to the various platforms----digital, TV, magazines, radio, etc. it is a good idea to state the dollar amount as well as the percent gain or loss. A lot of people who read that digital video is "up 30%" may think that its spending is larger than, say, magazines, which are "down 5%". A small point, but I've seen this happen many times.

  2. Ed Papazian from Media Dynamics Inc, May 19, 2016 at 10:38 a.m.

    Wayne, sorry to be a pest, but in your table all of the individual TV segments show increases much higher than the figure for all of TV. How can that be?

  3. Joe Mandese from MediaPost Inc., May 19, 2016 at 2:35 p.m.

    @Ed (MediaPost Editor Joe Mandese here). The answer is that spot TV (-10%) share of the total was enough to bring the total's average down to +5%.
    Here are the shares by national TV type, courtesy of SMI:
    Share – April 2016
    Cable TV 45.1%
    Broadcast TV 36.0%
    Spot TV 9.9%
    Syndication 4.0%
    Local/MSO Cable 3.8%
    Ad Sales House 1.1%
    Other 0.1%
    100.0%

  4. Ed Papazian from Media Dynamics Inc, May 19, 2016 at 3:46 p.m.

    Thanks, Joe. My mistake on the spot TV figure, I didn't note that it was a minus not a plus. I see that we are talking only about national spot, which has been lagging for some time. I believe that local spot is doing much better, especially thanks to the political activity in various states. This is probably true of spot cable as well.

Next story loading loading..