
OTT viewing time is starting to
approach that of live TV, according to TiVo’s Video Trends Report for second quarter 2019 (chart above).
More than half (52.4%) of respondents to the North American survey
reported regularly watching one hour or more of OTT-delivered content, compared to 65.8% reporting the same for live TV. Nearly half (46.8%) also reported watching an hour or more of DVD-ed content,
and 41.5% said they watch an hour or more of sports across live TV, OTT and DVR.
Interestingly, the numbers reporting that they don’t watch regularly increased across all three: 19.3%
say they don’t watch live TV regularly, up from 10.3% in 2018; 39.9% that they don’t watch OTT regularly, up from 27.8%; and 44.8% that they don’t watch DVR-ed content regularly, up
from 25.4%.
advertisement
advertisement
TiVo, which has been conducting quarterly consumer video trends surveys since 2012, issues reports twice yearly. For the Q2 research, a third-party surveyor polled 5,340 consumers
18 and older in the United States and Canada. TiVo analyzes the data.
Respondents were asked about their use of a wide variety of services and devices (on a one-by-one basis), including linear
pay TV, OTT, both subscription-supported and advertising-supported (SVOD and AVOD) streaming, and free social media streaming channels (e.g., Facebook, YouTube).
North American households
now use an average of 7.2 entertainment services -- up from 6.3 average services per household reported in TiVo research in 2018, and averages of about 4 and 5 services, respectively, in 2016 and
2017.
Looking at linear TV, this survey found 83% of respondents still having cable/satellite service. While only 27% reported being “very satisfied” with these services,
that’s up 9.4% from last year — perhaps a glimmer of positive news for linear. Meanwhile, customers saying they’re “very satisfied” with vMVPDs (virtual multichannel
video programming distributors) like Sling TV, DirecTV Now and YouTube TV decreased by 37%:

Among those who said they’re cord cutters, 85% cited the too-high price
of pay TV as the reason, 49% said they were switching to using only an internet streaming service like Netflix or Hulu, and 24% said they were moving to using only free antenna TV.
While big
SVODs by and large continue to report increasing subscriber counts, 30.5% of these respondents still say they have no such subscriptions.
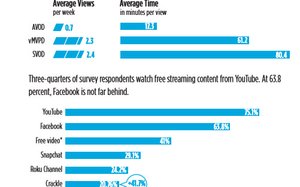
Those who use streaming services indicated that they
spend the most time watching SVOD, followed by vMVPDs, and least on the still relatively new AVODs. But free video from social media platforms such as Facebook and Snapchat garner the most individual
views per week, and follow close behind SVOD in time spent:
At the same time, the results indicate stalling or
declining use of vMVPDs. The percentages reporting using YouTube TV declined from 12% last year to 8.5% this year; DirecTV Now from 6.3% to 4.3%; and PlayStation Vue from 4.4% to 3.3%. Use of Hulu+
Live TV and Sling TV were basically flat at 6.7% and 3%, respectively.
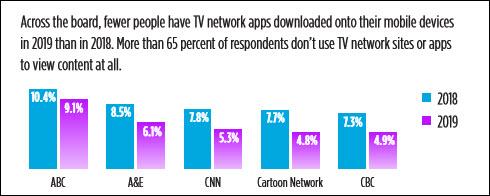
Also, adoption of linear AVOD services like Pluto TV and Tubi TV is growing (now at 18.5% and 16.2%, respectively), while
adoption of TV network sites and apps is slowly declining:
The most popular services “bundles” put together by consumers to
get the types of content they want include Facebook, YouTube and Pay TV (cited by 40% of respondents); Netflix, YouTube, Pay TV (29.1%); Netflix, Facebook and YouTube (26.7%); free video (from network
sites or apps), YouTube and pa TV (24.2%); free video, Facebook and YouTube (22.7%); and free video, Facebook and pay TV (21.2%).
When it comes to streaming devices, 34.9% said they
don’t own one, while 22% said they use a device to access pay TV.
Smart TVs are most prevalent (27.6% of respondents), followed by Roku (21.3%), gaming consoles (20.1%), Amazon Fire
Stick (17.7%), Google Chromecast (10.8%) and Apple TV (10.3%).
Asked which services they use to seek out content, respondents showed a clear preference for cable/satellite TV, SVOD services
like Netflix and Amazon Prime Video, and free YouTube videos.
Nearly a quarter (23%) said they’d like their channel guides to get a new format “categorized into groups of movies
and TV shows.” But 44.6% said they don’t want their guides to change, and 32.4% said they want to keep their old guide and add a differently formatted one.
Unsurprisingly, half
(50.7%) said they want the ability to search for TV shows and movies across different platforms.
The full report can be downloaded from TiVo’s site.