Cover Story: All The News Barely Fit For Print


In an unprecedented graphic alteration of its 
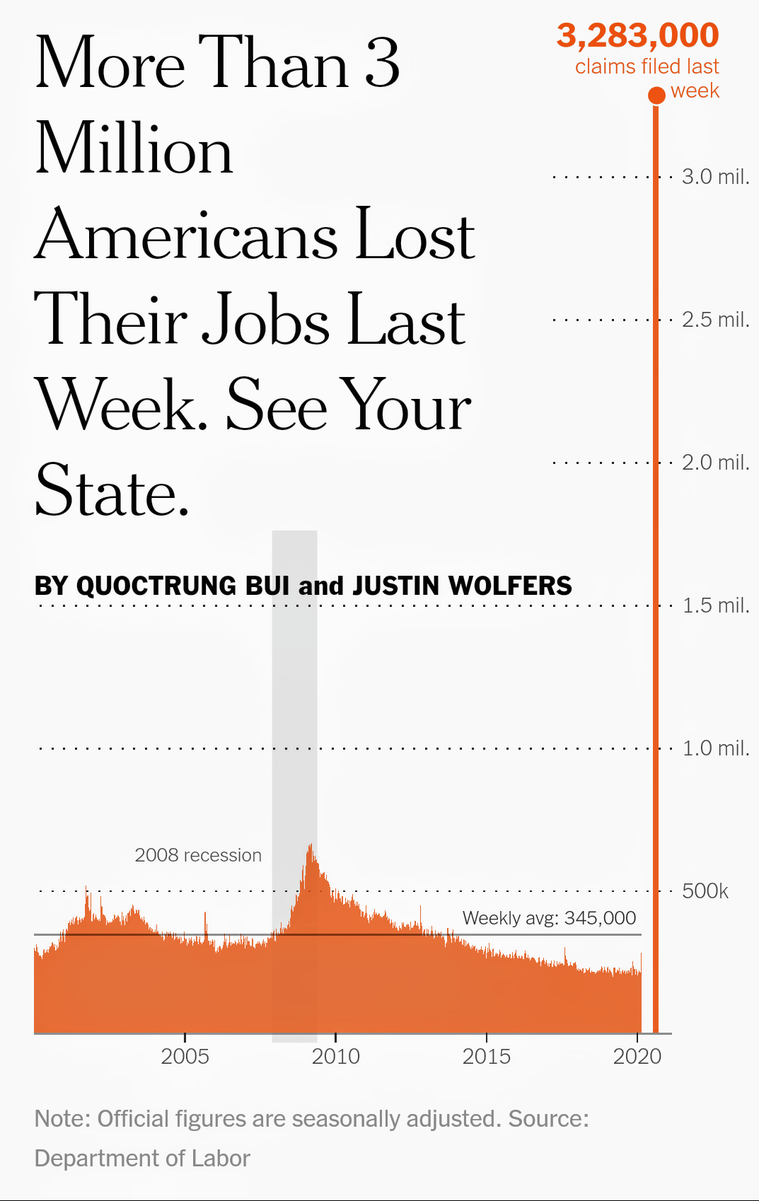
front page, today's print edition of The New York Times takes over the entire length and all six columns of width to display a chart depicting the record 3.3 million surge in unemployment claims announced this week.

The chart shows a horizontal bar chart of unemployment filings running from 2000 to March 2020, including the Great Recession, ending with a sudden spike on the right side of the 22 by 12 inch broadsheet.

A more easily readable digital version of the chart is shown below.

advertisement

advertisement

1 comment about "Cover Story: All The News Barely Fit For Print".
Check to receive email when comments are posted.
  1. pj bednarski from Media business freelancer, March 27, 2020 at 8:53 a.m.

    It's not the front page and it's not such an amazing graphic but the Business page front shows the recent unemployment stats for each of the 50 states and a graphical spike for the stats announced yesterday. Absolutely stunning! Pennsylvania had 378,808 jobless claims last week! (That's more than the population of Pittsburgh!) No other state comes even close to that. Ohio--187,784, California 186,809. Michigan, Minnnesota, North Carolina, New Jersey, Massachusetts. Wow...National media focus on New York City, but look around. 

Next story loading loading..