New Comscore data
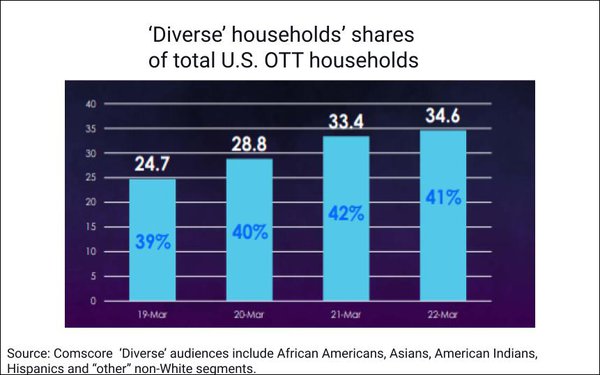
confirms that ‘diverse’ households — meaning African-American, Hispanic, American Indian, Asian and other non-white audiences — are driving streaming
growth.
Diverse households accounted for 41% of WiFi-enabled U.S. OTT households as of March 2022 — up from 39% in March 2019 (chart above).
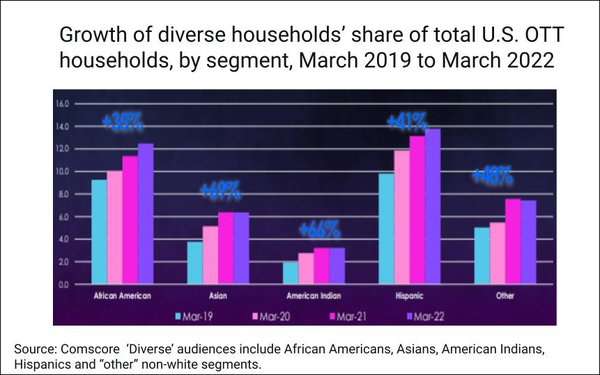
Over that timeframe,
Hispanic OTT households increased 41%, African-American OTT households increased 35%, Asian American households increased 69%, American Indian households 66%, and other 48%.
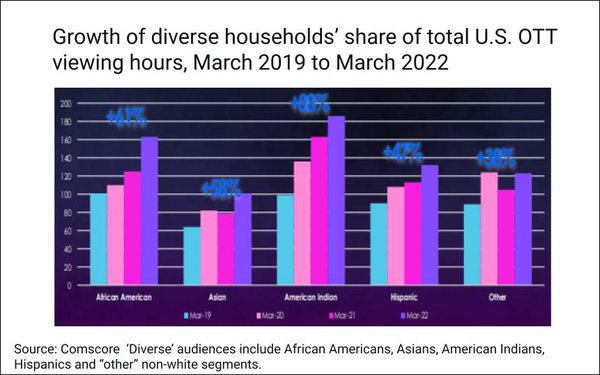
OTT viewing hours by household rose 61% among the
African-American households, 47% among Hispanic households, 58% among Asian households and 88% among American Indian households.
advertisement
advertisement
In terms of number of streaming services per household, African-American
households average 6.3, and Hispanic households 5.6, versus the overall national average of 5.5.
Asian households are under the national average, at 4.9 services.
In terms of OTT
viewing days per household per month, African-American, Hispanic and Asian households are at 23, 22 and 21 days, respectively — roughly on par with the national average of 22 days.
Across all U.S. audiences, total OTT households rose from 40 million to 47 million between March 2021 and March 2022, and total average connected TV viewing hours per month rose from 4.7 million to
5.4 million.