Marketers may be under-using some types
of connected TV (CTV) platforms and content genres, according to a new survey commissioned by mobile marketing analytics and attribution platform AppsFlyer.
The survey, conducted in August and
September by Global Surveyz Research, spanned two groups: 200 director/C-suite marketing/martech executives from gaming, retail and fintech companies, and 500 consumers between 26 and 50 who watch
CTV. Respondents in both groups were from North America, Europe and APAC, with 24% of advertisers and 36% of consumers from the U.S. The marketers asked to participate have all built mobile apps and
have run (64%), or plan to run (36%), CTV campaigns to drive mobile conversions. They were recruited through a global BtoB research panel and invited to respond via email.
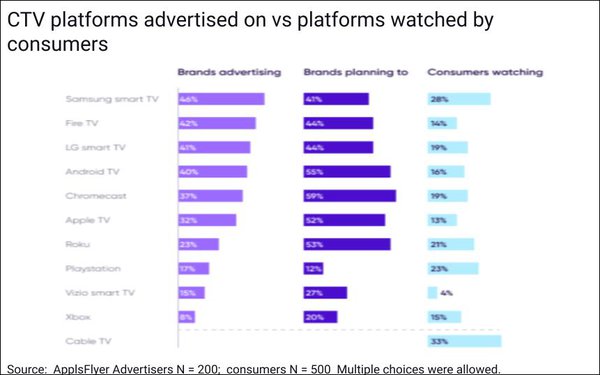
Marketers were asked
which streaming device brands they advertise on currently and which they plan to advertise on, and consumers were asked which devices they use to watch CTV.
advertisement
advertisement
Based on consumers’ reported
usage, CTV advertising investments within this group of marketers, at least, appear to be somewhat over-weighted to smart TVs and under-weighted to gaming consoles such as Playstation and Xbox. (Chart
top of page.)
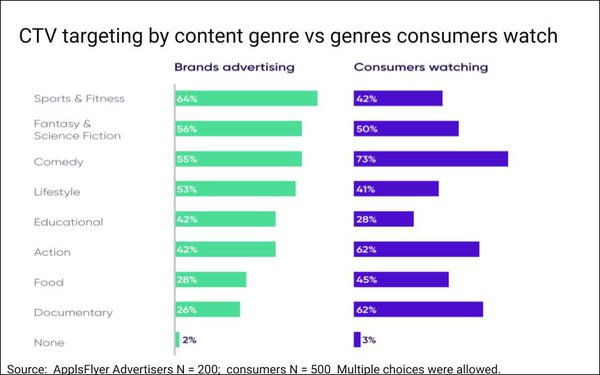
Additionally, these marketers’ investments by content genre do not necessarily align with the proportions of consumers watching the categories.
For example,
64% are targeting sports and fitness, while only 42% of consumers report watching sports. In the other direction, 62% of consumers report watching documentary content, but just 26% of marketers
reported targeting that content.
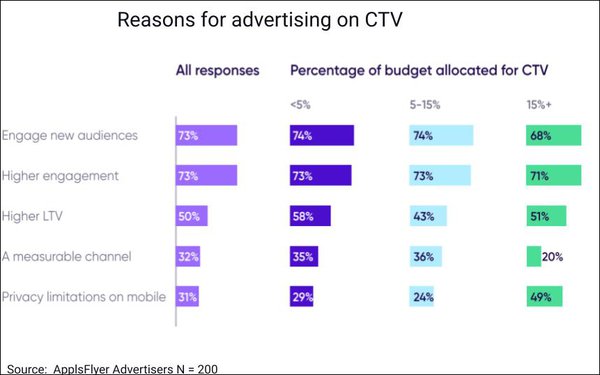
The
marketers’ most-cited reasons for using CTV were reaching new audiences (73%), increasing engagement levels (73%) and driving higher lifetime value (50%).
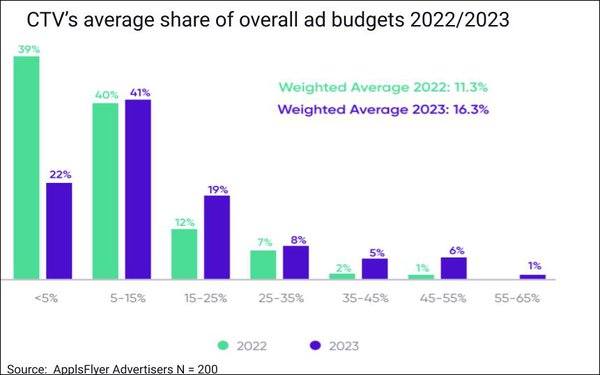
CTV’s reported share of overall ad budgets for 2022
averaged 11.3%, with marketers planning to up that to 16.3%, on average, next year.
The top KPIs that brands aim to improve when advertising on CTV are return on
advertising spend (ROAS), lifetime value (LTV) and retention. The top KPIs among those with the highest percentages (15%+) of advertising budgets already allocated toward CTV are cost per install
(CPI), ROAS and LTV.

Interestingly, although the
advertisers surveyed are marketers of mobile apps, nearly all of them (except 2%) indicated that they believe that ad spend in CTV will eventually surpass spend in mobile. Thirty-seven percent think
that will happen within three to five years, 25% within two to three years, and 36% predict it will happen “one day.”
Queried about use of QR codes, 38% of marketers reported that
the codes work well for driving mobile app installs, and 26% said they don’t perform well. Another 33% indicated willingness to test the codes.
Consumer CTV
Behaviors/Perceptions
The consumer sample was split about evenly by age (51% under 42, 49% over 42) and gender (50/50).
Eighty percent report watching CTV on TVs, 70% on mobile
phones, 46% on desktop/laptop and 36% on tablet.
Probed on advertising attitudes,14% said they don’t want to see any ads on CTV, 30% said ads “don’t bother” them, 41%
said it depends on the cost of the content/service, and 15% said it depends on the amount of ads.
Asked what would stop them from watching CTV, 39% cited “too many ads,” 20%
privacy-related issues, and 12% “non-relevant ads,” while 6% said nothing would stop them from watching it.
On average, consumers said they’re fine with watching 1.7 ads
within 30 minutes of content. But if the ads are relevant, this sample of consumers claim they would be willing to watch 5.8 ads on average during that short viewing timeframe.
On average,
consumers reported watching 5.3 hours of streaming content on CTV per week. In North America, the average is 11% higher, at 5.9 weekly hours.
Forty percent overall overall (and 50% in North
America) said they’ve downloaded mobile apps after seeing ads for them on CTV.
More than half said they are quite likely (40%) or very likely (13%) to do this using QR codes, versus 28%
and 19%, respectively, saying that they are not very likely or not at all likely to do so.