

Facebook Launches Density Maps To Aid In Sophisticated Collection Data
- by Gavin O'Malley @mp_gavin, May 20, 2019
Showing that its immense power can be used for good, Facebook is rolling out new tools to help governments, health organizations and researchers track everything from population numbers to disease outbreaks.
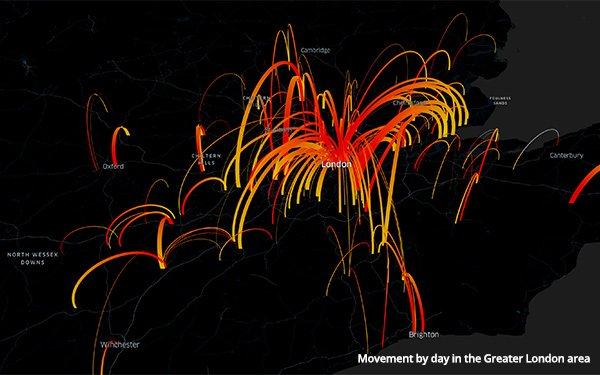
Specifically, the embattled social giant just launched three population density maps with demographic estimates, movement maps and network coverage maps.
Ideally, the maps with help health partners better understand where people live, how they are moving and whether they have connectivity, according to Laura McGorman and Alex Pompe, Facebook Data for Good’s policy lead and research manager.
“All of these maps, when combined with information from health systems, can improve the way organizations deliver supplies and respond to outbreaks,” McGorman and Pompe suggest in a new blog post.
Launch partners include the Harvard School of Public Health, UNICEF and the World Economic Forum, to name a few.
Facebook has experimented with various do-gooder endeavors for years.
Two years ago, the company began working with Columbia University to use satellite imagery and census data to build detailed population maps to improve connectivity projects.
While working with the American Red Cross and its Missing Maps project, McGorman and Pompe said their team realized maps could have profound applications in public health.
The new high-resolution maps estimate the number of people living within 30-meter grid tiles and provide insights on demographics, including the number of children under five, the number of women of reproductive age, as well as young and elderly populations.
The new maps are not built using Facebook data. Instead, they rely on combining the power of machine vision AI with satellite imagery and census information, according to McGorman and Pompe.
