Commentary

Whoa, Nellie! Will It Be Linear By A Nose?

As someone who has covered Nielsen ratings for much of my career, I can tell you the natural inclination for a trade journalist is to cover them like a horse race: someone finishes first, second, third, etc.

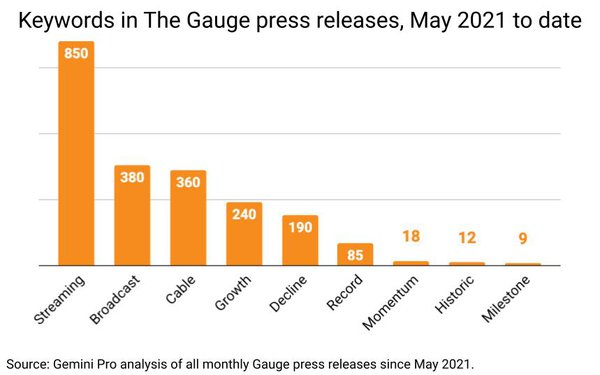
Based on an analysis of nearly five years of monthly press releases, it appears that's how Nielsen has been spinning the story too. And the winner by -- way more than a nose -- has been streaming.

We'll find out exactly how accurate those photo finishes have been on March 24 when Nielsen publishes a restated version of its monthly Gauge, but based on a keyword analysis of the past five years, "streaming" has been mentioned 850 times -- more than twice the combined number (740) of "broadcast" and "cable" have been mentioned.

advertisement

advertisement

The bias makes obvious sense, given the industry's transfixion -- and the inherent news value -- of "growth" vs. "decline."

The releases set a Nielsen personal best "record" of 85, showed some "momentum" and noted "historic" "milestones."

I'm not sure whether and how all that spin can be restated, even if the numbers underlying all those press releases are, but Nielsen will probably let the new numbers speak for themselves and double down on its background guidance:

"In the short term, you can expect to see a lift for cable and broadcast viewing. But the long term trends will still hold for cable, broadcast and streaming. Streaming is still expected to grow, as long term trends have indicated."

At presstime, it was unclear whether Nielsen will also retroactively correct the historic spin published by five years of inaccurate Gauge releases, but at the very least it should restate the 10 months since it published 
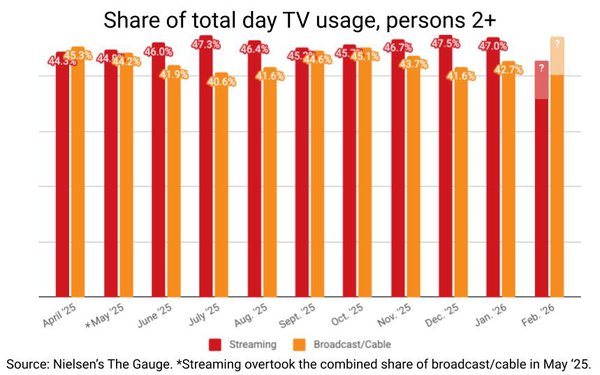
May 2025 estimates showing streaming had effectively taken the horse race lead (see below).

1 comment about "Whoa, Nellie! Will It Be Linear By A Nose?".
Check to receive email when comments are posted.
  1. Ed Papazian from Media Dynamics Inc, March 16, 2026 at 6:40 p.m.

    Joe, what seems to have happened is that a decision was made to use the ARF's DASH study findings--based on a sample of only 10,000 per year--re universe estimates instead of whatever Nielsen was using as its projection bases. As the DASH estimates are different slightly, this will casue the projected "audience" data---and shares by platform--- to change slightly. But that does not mean that the previous Gauge reports were "inaccurate". 

    As I'm sure, you know, no survey--big data or otherwise--knows exactly how many homes or people there are in the universe it is purporting to measure. All that is known is what percent of those who it interviewed or measured mechanically did something--like watched a particular episode of a TV show. Say, it's 5% of all men living in U.S. TV homes per the survey's sample. To get a whole number  the researchers must go to an outside source--or several sources--and come up with a number for that population group. Then they sample balance and eventually assign a projection weight to each man in their sample. So if there are 100 million men in U.S. TV homes--by an independent estimate--and the survey found that 5% of its men watched that show, the projected number of men viewers is 5 million. 

    There have been cases before when this kind of situation came up. Among the MRI, Simmons battles I believe there were times when one of the contenders projected adult audiences to the total adult population, including those living in "group quarters"--prisons, old age homes, college campus dorms, etc. ---when it did not sample such people. Result:  5% larger adult readership projections. 

    In short, this is more a procedural issue than a methodological matter. The projected numbers will change, but it's not because the meters or button pressing were necessarily wrong before--or correct, now. We will never know exactly what the "truth" is down to the last viewer. No survey can deliver that degree of perfection.

Next story loading loading..