 In a pattern that seems to
be following the fragmentation of other media, Nielsen this morning released a report showing that while the number of apps available continues to rise, the number of apps actually used has remained
flat for the past two years.
In a pattern that seems to
be following the fragmentation of other media, Nielsen this morning released a report showing that while the number of apps available continues to rise, the number of apps actually used has remained
flat for the past two years.
The report, which utilizes software installed on mobile users’ devices capable of tracking their apps and app usage, found that the mobile device
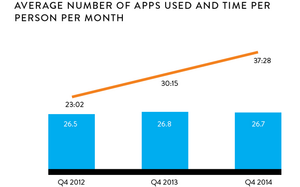
users utilize an average of 26.7 apps per month. While Nielsen did not provide a universe estimate for the number of apps available to them, the report noted that it currently is in the
“millions” and that news ones are “being rolled out every day.”
The findings are interesting, because they follow a similar pattern to the fragmentation of
television that -- despite a steady increase in the number of channels available -- the average TV household actually watches relatively few.
advertisement
advertisement
Nielsen no longer discloses the number
of channels receivable by the average household in its annual Total Audience Report, but the number of TV channels “viewed” has remained stable for the past three years it has reported
that statistic, declining slightly to an average of 21.0 in 2014 vs. 21.7 in 2013 and 21.4 in 2012.
The definitions of channels “viewed” and mobile apps
“used” may be semantic, but the findings support a universal truth about the media universe overall -- that despite the exponential growth of media options, people still gravitate to a
relatively finite array of options.
During the early years of TV’s channel explosion, CBS research chief Dave Poltrack explained this phenomenon by a principle of human
cognition known as the “magical number seven, plus or minus three,” which states that given an unlimited number of options, people tend to choose among seven, plus or minus three.
Technological
augmentation of humans -- whether it is TV’s electronic programming guides and on-demand and digital video recorders, or mobile’s searchable and quasi AI features -- seem to be extending
the limits of the number of choices that human beings can process, access and use, but the new Nielsen data shows that even a potentially infinite app universe has its upper limits: currently about 27
per month, per person.
But another finding in the report shows that like television, people are showing greater elasticity in their usage of mobile applications in another media
dimension: time.
Just as the time that consumers spend watching television continues to rise, the amount of time they spend utilizing mobile applications continues to expand, despite
the fact that the number of apps used on average remains relatively flat.
The amount of time the average mobile user spent using their apps each month grew to 37 hours and 28 minutes
in the third quarter of 2014 -- a 24% increase from the third quarter of 2013, and a 63% increase from the third quarter of 2012.
“While there appears to be a consumer
threshold to the total number of apps people are willing and/or able to actively use during the month, the time they spend engaging on those apps has increased,” reads the Nielsen report,
noting: “In fact, the monthly time spent per person has increased from 23 hours and two minutes in fourth-quarter 2012 to 37 hours and 28 minutes in fourth-quarter 2014 — a 63% rise in two
years! So the reward for being one of the chosen apps is heavy engagement by the user.”
“The real battle is going to be share of icons on screens,” The Media Kitchen President
Barry Lowenthal says, noting that while there may be an infinite number of apps available to the average mobile consumer, getting them to download, install and place them on a prominent position on
their mobile screen -- ideally their home screen -- will determine the extent to which they actually use them.