Streaming video ad attempts in the
second quarter declined 28% globally and 22% in the U.S. as compared to this year’s first quarter, according to Conviva’s just-released “State of Streaming” report for the
period.
Ad attempts are the number of times ads were called from the server to appear on a streaming or connected TV program.
Viewing time-spent on streaming and
connected-devices continued robust growth in the period: Up 63% globally and 57% in the U.S. versus last year’s second quarter.
However, growth rates in May and June slowed compared to
their height in April, when shelter-in place orders drove streaming viewing up 81% compared to April 2019.
Ad Quality Improved
While advertising demand
dropped, partly due to a lack of sports, streaming ads saw significant improvements in overall quality.
advertisement
advertisement
Viewers spent 38% less time waiting for an ad to start in Q2 as compared to Q1. As
a result, pre-ad viewer-initiated exits dropped 22%. Ad picture quality also improved, with bitrate up 53%.
But despite quality improvements, nearly 45% of ads represented missed
opportunities — meaning ads not filled or not played as intended. The most common advertising issue continues to be the lack of demand as publishers try to fill ad slots, but no relevant ad is
available.
“Shelter-in-place mandates skyrocketed streaming viewership in April, led by Europe, which saw a 174% increase year over year,” said Bill Demas, CEO, Conviva.
“Unfortunately, advertising moved in the opposite direction, with global demand significantly reduced due to COVID-19. We expect advertising to bounce back in the coming quarters as the industry
and viewers acclimate to a ‘new normal’ including streaming being part of the everyday routine.”
Smart TV Sees Triple-Digit Increase
Globally,
native smart-TV’s viewing time increased 239% year-over-year.
Also bolstering television viewing were connected TV devices (Roku, Amazon Fire TV and others), which saw a 61%
increase in YoY time spent, and game consoles, which saw a 55% increase.
Among smart TVs, Samsung commanded half of all viewing time, followed by LG TVs (23%), Vizio (11%),
Android (8%) and Amazon Fire (7%).
Among CTV devices, Roku remained the leader, capturing half of the total viewing time for the category. Amazon Fire TV captured 29%, Apple TV
8.7%, Chromecast 7.3%, Android TV 3.6% and Humax 1.3%.
Among gaming consoles, PlayStation garnered 50% of streaming viewing time versus Xbox’s 47%.
Connected TV devices had the largest share of viewing time in both North America (56%) and Europe (32%). In South America, smart TVs (40%) had the largest share (40%). Desktops are still the
primary streaming devices in Asia (49%) and Africa (43%).
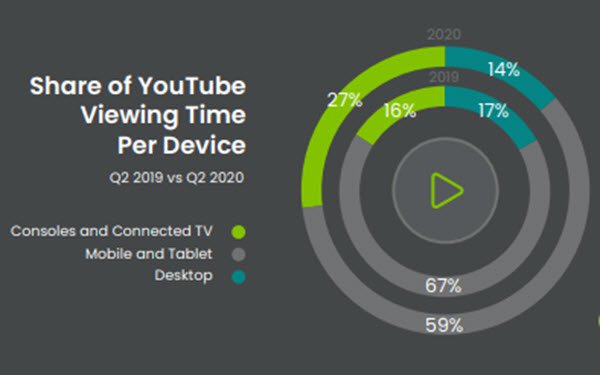
Viewers Embrace YouTube on Bigger Screens
While YouTube is primarily watched on mobile devices --
which had a 59% share of time-spent in Q2 -- CTVs and consoles had a 25% share of YouTube viewing in the period — up 69 percentage points from a 16% share in Q2 2019 (see above).
Data
for Conviva’s report is collected primarily from its sensor technology embedded in 3 billion streaming video
applications, which measure more than 500 million unique viewers and 150 billion streams per year and 1.5 trillion real-time transactions per day across more than 180 countries. Year-over-year
comparisons were normalized at the customer level for accurate representations of industry growth. The social media data are based on an analysis of data from 1,200-plus accounts, more than 5 million
posts, and more than 7 billion engagements across Facebook, Twitter, Instagram and YouTube.