
Streaming viewing time, already up 266% globally over
the past three years, jumped again in Q3 — by 21%, according to the latest State of Streaming report from Conviva. Africa led growth, at +273%, while North America continued modest growth
(+2%).

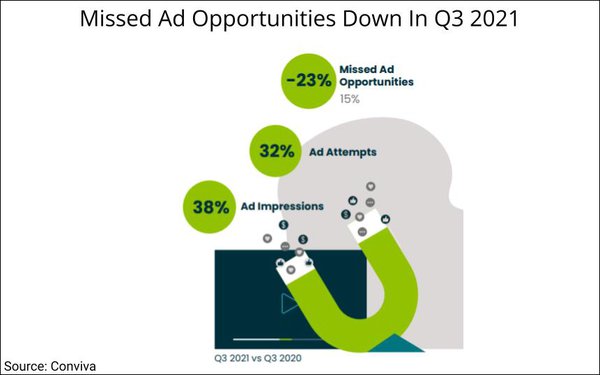
And after rocky ad
performance last year, Q3 saw global ad attempts rise 32% and ad impressions grow 38% compared to Q2 2021, resulting in a significant 23% overall quarter-over-quarter decrease in missed ad
opportunities.
The ongoing
improvements reflect leading streaming publishers’ continued focus on real-time analytics and intelligence to optimize user experience and maximize return on investment, according to the report.
“As advertising quality improves and more advertisers see the value of doubling down on their investments in streaming, the caliber, relevancy and overall ad experience for consumers is likely
to improve as well,” it adds.
advertisement
advertisement
From the standpoint of viewers’ experience of ads, or ad quality, the picture was more mixed (chart top of page).
Globally, ad start
time was down 23% versus last quarter and — in a positive development for consumers who report wanting shorter ad breaks — ad duration decreased 3% versus Q2, to 26 seconds.
But ad buffering increased 22% compared to last quarter, to a rebuffering rate of 1.3%, and picture quality also worsened slightly: down 1%, to a 2.93 Mbps average bitrate.
“As
competition continues to heighten and consumer dollars are increasingly spread thin across platforms, quality of the ad viewing experience will be an important factor in keeping viewers engaged for
more monetizable minutes,” stresses Conviva.
But users’ overall streaming experience on technical aspects continued to improve on nearly all fronts.
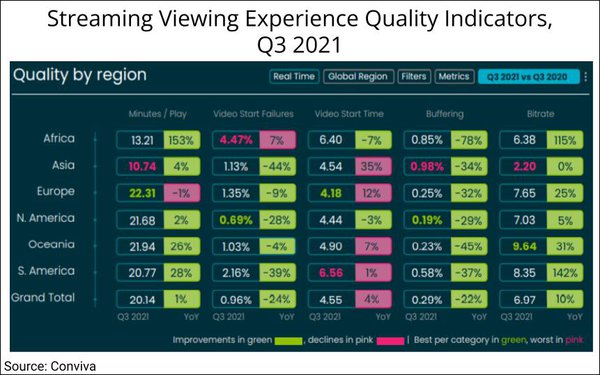
Notably, buffering was nearly eliminated: Q3 marked
the first quarter that all six regions measured tallied buffering under 1%, after significant improvements in recent quarters.
Buffering declined 29% in North America, which
maintained its lead as the region with the least buffering, at 0.19%.
Video start failures decreased for every region except Africa. Picture quality (bitrate) was up 10% globally and 5%
in North America.
Video start times were the exception to the positive trends, with just two regions showing decreases versus Q3 2020: Africa down 7% (to 6.4 seconds) and North America
down 3%, (to 4.44 seconds). Europe had the best start time, at 4.18 seconds, despite an increase of 12% in the period.
Minutes per play improved in all regions but Europe, which still
had the highest number (22.31), despite a 1% decline versus Q3 2020. North America was second, rising 2% to 21.68 minutes per play in the period. Globally, minutes per play rose 1%, to average
20.14.
By device, connected TVs (CTVs) had the highest minutes per play (27.56) despite a 1% decline versus Q3 2021, while mobile had the lowest (9.11), despite a 4% increase in the
period.
Big screens — including CTV devices, smart TVs and gaming consoles — continued to dominate, accounting for nearly three quarters (73%) of viewing time
worldwide.
Roku, Amazon Fire TV and Samsung TV made up the bulk of big- screen viewing time globally.
Roku was No. 1, with a 31% share; Fire TV fell declined to 16.8%, from
20% in Q3 2020; and Samsung gained nearly 3 percentage points year-over-year, rising to 12.2% from 9.4%. 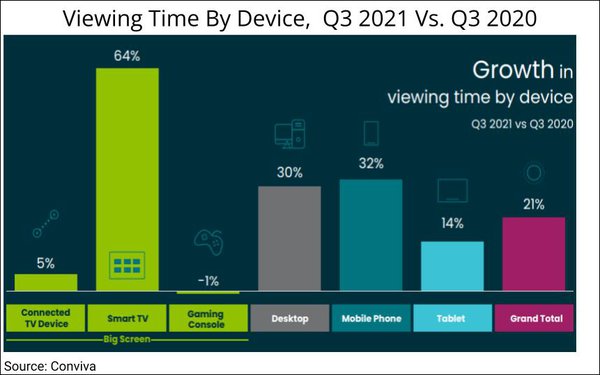
To test new content and promote their catalog with viewers,
streaming platforms continued heavy investment in video content on social media, particularly YouTube. Platforms upped their content on YouTube by 97%, driving a 24% increase in engagement.
The Q3 report’s streaming data was collected primarily from Conviva sensor technology embedded in nearly 4 billion apps on streaming devices, and its social data from more than 2,800 accounts
and 18 billion engagements across Facebook, Instagram, TikTok, Twitter and YouTube.