Ecommerce brands did well last year,
judging by Decile’s new study: 2024: How did you stack up against industry peers?
Decile analyzed the metrics of five vertical sectors: Home goods, fashion &
apparel, health & beauty, food & beverage and supplements.
What can you learn from these types of businesses, assuming you’re not working in one of them?
“Benchmarking against industry averages is an important step in analyzing the overall health of a brand’s marketing program,” says Cary Lawrence, CEO of Decile.
With that in
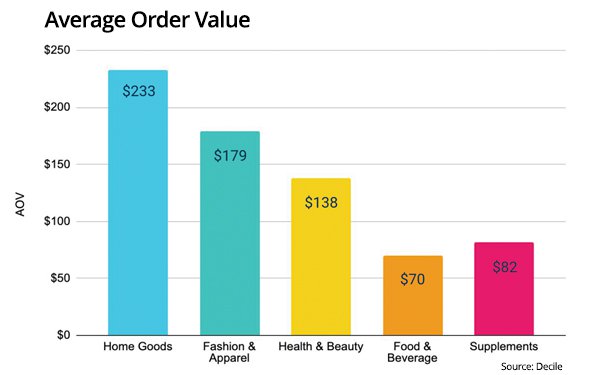
mind, Decile reports the home goods category had the highest average order value by far. But it also pulled the lowest retention rate.
Here are the average order
metrics:
- Home Goods — $233
- Fashion & Apparel — $179
- Health &
Beauty — $138
- Food & Beverage — $70
- Supplements — $82
advertisement
advertisement
Home Goods also led in
revenue per customer:
- Home Goods — $325
- Fashion &
Apparel — $263
- Health & Beauty — $306
- Food &
Beverage — $169
- Supplements — $243
Perhaps because some home goods products are
high-ticket, the category was last in terms of purchase frequency:
- Home Goods — 1.4
- Fashion & Apparel — 1.5
- Health & Beauty — 2.0
- Food & Beverage — 2.4
- Supplement —
2.9
Home Goods also was last in its repurchase rate:
- Home Goods — 18%
- Fashion &
Apparel — 22%
- Health & Beauty — 25%
- Food & Beverage — 31%
- Supplements — 48%
In addition, Home Goods was at the bottom in terms of the retention rate:
- Home Goods —
15%
- Fashion & Apparel — 18%
- Health & Beauty — 20%
- Food & Beverage
— 25%
- Supplements — 43%
However, Home Goods also topped the list when it comes to the Lifetime Value (ltV: Customer
Acquisition Cost Ratio:
- Home Goods — 4.3
- Fashion & Apparel — 2.1
- Health &
Beauty — 1.4
- Food & Beverage — 3.2
- Supplements — 2.5
And Home Goods beat out other sectors
in the First Order Payback rate:
- Home Goods — 227%
- Fashion & Apparel — 151%
- Health & Beauty — 103%
- Food & Beverage — 158%
- Supplements — 99%
“While 2024, was not without its macro-environmental challenges, it seems the ecommerce landscape remains on an upward trajectory in terms of improving its effectiveness in attracting
and retaining customers,” Lawrence concludes.