The NCAA March Madness tournament and higher news
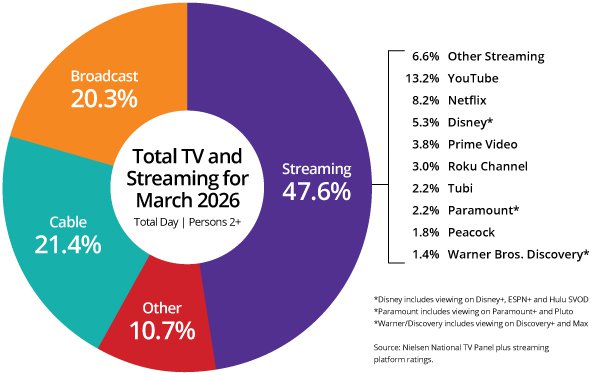
viewing gave overall cable a 7% spike (to 21.4%) in March versus February -- the only TV segment category to see an increase versus the previous month, according to Nielsen’s Total TV/Streaming
Index.
Driven by viewing for the three-week NCAA tournament, the broader Nielsen Media Distributor Index showed Paramount Skydance and Warner Bros. Discovery had higher viewing to 8.1% (up
16%) and 6.1% (up 10%), respectively, versus February.
Still, cable share for the month is down versus a year ago -- from 24.0% in March 2025 -- while broadcast was also down to 20.3% (vs.
20.5% a year ago).
Year-over-year, streaming still grew to 47.6% (from 43.8%). YouTube rose to 13.2% vs. 12.0% in 2025, and Netflix was up to 8.2% (vs. 7.9%), followed by Disney (Disney+, Hulu
and ESPN) at 5.3% (vs. 5.0%) and Prime Video with 3.8% (vs. 3.5% in 2025).
advertisement
advertisement
Roku made the biggest gains for a streamer in terms of percentage with a 3.0% share versus 2.2% a year ago -- an
increase of 27% compared to 2025.
The Roku Channel now has a bigger share than three of the legacy TV network-owned streaming services, with Paramount (Paramount+ and Pluto) at 2.2%,
NBCUniversal’s Peacock with 1.8%, and Warner Bros. Discovery (HBO Max, Discovery+) at 1.4%.
Looking at the broader Media Distributor Index, Walt Disney remained the same with a 10.5%,
coming in second to YouTube, while NBCUniversal + Versant Media grew to 8.4% (vs. 8.0%) as a result of a strong news period. Fox Corp. came in at 7.1% (vs. 7.0%) due to higher news viewing that
benefited Fox News Channel.
Paramount was down year-over-year to 8.1% (vs. 8.5%), while Warner Bros. Discovery dipped to 6.1%, from 6.7%.