Total Ad-Supported Viewing Up 2% In Q2: Nielsen

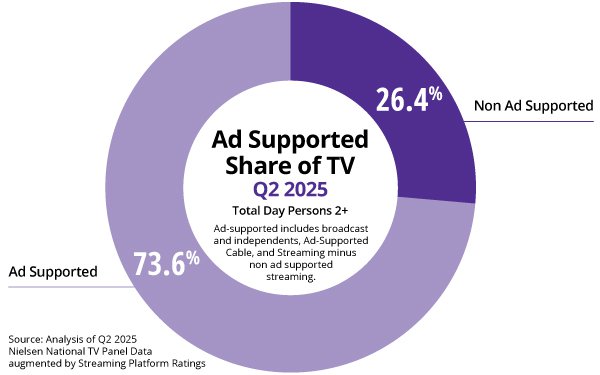
Second-quarter ad-supported total day viewing for persons age two and up -- on linear and streaming TV platforms -- grew 2% (1.2 share points) in the second quarter to 73.6% from the first quarter, according to Nielsen.

Specifically, ad-supported streaming grew 7% (2.9 share points) to 45.3% share.

Streaming platforms gained from new seasons of popular shows such as Peacock’s “Love Island USA” and Netflix’s “Squid Game” and “Ginny & Georgia.”

Broadcast ad-supported viewing dropped 16% (down 2.7 share points) to 26.0% share (28.7% in the first quarter).

Ad-supported cable slipped by half of broadcast’s decline -- 8% (down 0.2 share points) -- to 28.7% share (28.6%, the first quarter).

Cable TV ad-viewing was helped in the quarter by strong news content in the period, with additional high viewing from the NBA playoffs.

Total ad-free TV/streaming fell 4% to 26.4% share (27.6% in the first quarter).

Overall viewing -- ad-free and ad supported-- was down 9% in the second quarter compared to the first quarter.

Nielsen’s ad-supported measure, which comes from national TV panel data with streaming platform rating, was initially released for the first quarter of 2025.

advertisement

advertisement

4 comments about "Total Ad-Supported Viewing Up 2% In Q2: Nielsen".
Check to receive email when comments are posted.
  1. Joshua Chasin from KnotSimpler, July 29, 2025 at 2:50 p.m.

    The Gauge numbers are interesting, but they always leave me with questions.(Maybe that's the idea.)

    So 73.6% of viewing is to ad-supported TV, Ad-supported streaming was 45.3%; Broadcast ad-supported, 26.0%; ad-supported cable was 28.7%.The latter 3 figures sum to 100%, so ad-supported streaming, e.g., is 45.3% of the 73.6%.

    Here's my question. If time spent viewing ad-supported content splits out--

    Streaming: 45.3%
    Cable: 28.7%
    Broadcast: 26.0%

    --What is the distribution of impressions, as opposed to time spent? We know spot load is lower on streaming; what does the shift in viewing-- specifically ad-supported viewing-- to streaming mean for the pool of available impressions? Are there fewer and fewer impressions available as viewers move to streaming? If yes, is this reduction uniform by age cohort? (One assumes not.) What % of impressions does streaming deliver? (One assumes fewer than 45.3%.) 

    I realize Nielsen doesn't want to give away the farm in a freely available report. But these are the kinds of questions that would keep me up at night, if I wasn't always so tired.

  2. Ed Papazian from Media Dynamics Inc, July 29, 2025 at 4:57 p.m.

    Josh, all that Nielsen has done is to characterize the  content it is able to identify--about 11%  can't be identified and are not included in this analysis--based on whether it spots any ads in them. If so the entire service--or source--- is considered ad-supported. .without regard to how many ads it displays.

    The ad supported streaming services have been running at  less than half the ad loads of linear TV but these are starting to increase. However fixng it at half, that means that every linear TV share point counts twice what a streaming stare point represents re ad impressions.. doing the math and using Nielsen's data that gives streaming a 29% share of ad impressions.But I happen to think that it's lower than that--maybe around 22%, currently.

    As for the gradual decline in GRPs, of course that's happening and much more on the young adult side. But who is to say that the linear TV sellers wont compensate for declining ratings by upping their ad loads---they seem to be able to get away with that--based on set usage, not attentive viewer, measurements. And I expect the streaming services to greatly increase their ad loads--brnging them closer and closer to the broadcast TV level. So, overall, the supply of ad GRPs may decline somewhat, but not as to the extent that is feared.

    One final point. Even if there is a decline of 10-15% in available ad GRPs for linear and streaming, as most brands operate in  competitive product classes even if one is confronted with a limitation of available GRPs so are its competitors--so "share of voice" is not necessarily compromised.

  3. Ed Papazian from Media Dynamics Inc, July 29, 2025 at 5:15 p.m.

    Commenting on my own comment-- if you characterize each service based on it carrying  any ads per hour--or a fixed number like 3, or 5---and then count all of its usge as ad-supported you have a problem in comparing it to other ad-suppoterd services and, especially, in combining them all to form a complete picture.

    Why? here's an example. Say there are only two linear TV networks and two streaming services. All carry ads. Each has a 2.0% share of all viewing. Therefore the splt in  ad-GRPs,  based on total usage time --is 50/50. But what if both linear TV networks present 35 commercials per hour while one of the streamers offers only 3 and the other 15? for an average of 8? Is there still a 50/50 split in ad GRPs? Answer: Nope. Now its roughly an 80/20 split in linear's favor.

  4. Ed Papazian from Media Dynamics Inc, July 29, 2025 at 5:22 p.m.

    Correcting my typo in the last post I meant 13 ads per hour for one of those streaming services, not 15, hence the average of 8 per hour.

Next story loading loading..