
Viewer "attention" of connected TV (CTV)/streaming ads
has dropped for the first time, according to TVision, since it has been measuring ads with its "eyes-on-screen" technology.
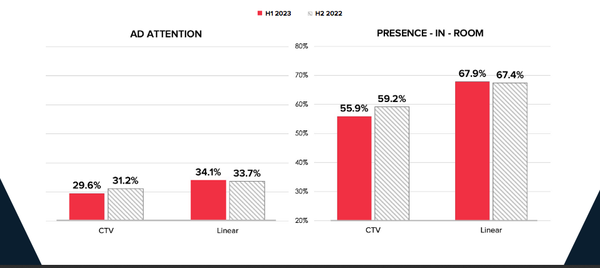
CTV/streaming ad attention slipped to 29.6% in the first six months
of 2023, from 31.2% over the same time period in 2022.

TVision's "eyes-on-screen" technology has been measuring "attention" to video
content since 2017. In addition, the more general "presence in the room" measure also dipped to 55.9% (from (59.2%)
The company reasons that this may be because of increasing on-screen
counters from apps that inform viewers during an advertising commercial break how long it will be until program content resumes.
advertisement
advertisement
In addition, it also says 40% of CTV ads were aired in lower
viewed late-night, overnight, and morning time periods.
By way of comparison, the study says only 20% of linear TV ads are delivered in these less attentive time periods. Linear TV
scored a 34.1% “ad attention” (up from 33.7% a year ago) and 67.9% “presence in-room” (67.4% in 2022).
At the same time, there has been a 38% increase in share of time spent on
ad-supported ads overall compared to the same six-month time period a year ago.
An additional 77% of “premium” apps for those services have ad-supported options -- such as
Netflix, Disney+, Prime Video, Peacock, and Paramount+ -- are more likely to deliver ads when viewers are in a room than “average” CTV apps. No definition was disclosed with regard to
“average” CTV apps.
In terms of best attention for individual apps, Apple TV+ (its ad-free video-on-demand app) posted a 136.7 index for the first six months of 2023.
YouTube TV (the virtual pay TV provider) was next with 120.9, followed by Prime Video (ad-free app) at 119.4; Netflix (a combination of ad-free and ad-supported options) at 113.4 and Peacock with
112.0 (a combination of ad-free and ad-supported options).
TVision says the average app attention score was 119.1.
TVision measures every time a person walks into a room,
detecting who the viewer is, where they are in the room, and what their eyes are looking at.
Its "presence-in-room" metric measures the amount of seconds that viewers are in the room,
while "attention" measures the percentage of ad impressions where a a viewer watches the TV screen for two or more seconds of programming and/or advertising on TV.
Data was collected
from an opt-in panel of 5,000 homes across the U.S., weighted to represent the country.
The Linear and CTV ad impression data was collected from January 1 through June 30, 2023.
