Time Spent With Media Reaches 'Saturation,' Declines First Time Since Great Recession

The good news is that consumer time spent with media continues to rise. The bad news is that the share of time it spends with ad-supported media continues to decline, according to just-released findings from the 2025 edition of PQ Media's annual Global Consumer Media Usage Forecast.

That's the trend in both the U.S. and the worldwide media marketplace.

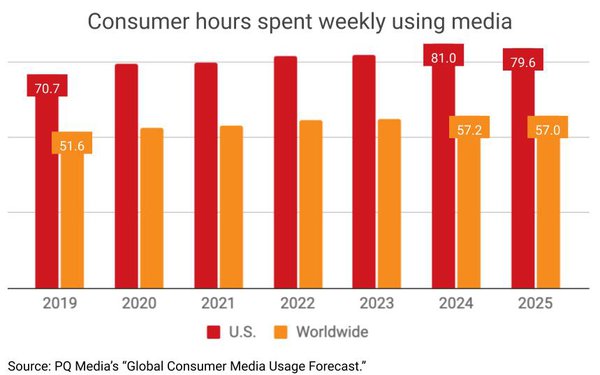
Globally, PQ estimates consumer time spent with all forms of media -- both digital and non-digital -- rose 2.4% to 57.2 hours weekly in 2024. That's an increase of 11.1% from the 51.5 hours weekly consumers spent with media in 2019, according to PQ, and follows a sharp recent deceleration in 2023 coming out of the COVID-19 pandemic.

That said, PQ forecasts worldwide consumer time spent with media will decline for the first time since the "Great Recession," dropping 0.3% to 57.0 hours weekly in 2025.

advertisement

advertisement

"Media consumption has reached its saturation point as digital device penetration rates having peaked in major developed markets, like the U.S.," PQ notes in its news report, adding: "Analysis of the 2024-2029 period indicates that media usage with rise in even years when most domestic and global markets hold federal elections, as well as major international sporting events like the Olympics, FIFA World Cup, and the World Hockey Cup."

On that note, PQ predicts American time spent with media will fall even more precipitously this year -- dropping 1.8% -- from 2024 to 79.6 hours weekly this year.

“Also contributing to the media consumption decline in 2025 is expected deceleration in discretionary spending on media devices and content, as consumers worldwide tighten their overall budgets due to an expected rise in inflation and possible recession due to the tariff wars instigated by the new Trump administration in the United States,” explains PQ CEO Patrick Quinn, adding: “However, the decline will be short lived, as gains are expected in 2026, when more than a dozen major countries hold federal elections, the Winter Olympics are held in Italy and the FIFA World Cup is tri-hosted by the United States, Mexico and Canada.”

On a parochial note for advertisers and ad-supported media, the share of time spent with ad-supported media will fall to its lowest points ever in both the U.S. (44.4%) and worldwide (52.3%).

6 comments about "Time Spent With Media Reaches 'Saturation,' Declines First Time Since Great Recession".
Check to receive email when comments are posted.
  1. Ed Papazian from Media Dynamics Inc, April 16, 2025 at 9:34 a.m.

    Joe, I'm sure that the folks at PQ Media will agree that these average media consumption figures do not necessarily mean that the consumer is  present while the device is on and certainly not whether the consumer is paying attention to either editorial content or ads.

    If an average consumer really was actively involved with 11-12 hours of media per day since that's an average that would mean that some consumers  spent 24 hours a day with the media whle others spent 17 hours, 12 hours, 7 hours, 5 hours and 2 hours--hence the average of 11-12 hours. At Media Dynamics Inc, we figure that the real average--including only attentive consumption ----is around 5-6 hours per day and  less than a hour of that involves ad messages.

    As for the trending, a 1-2 % change either way in the overall estimates is interesting but is it happening across the board or only for certain media? If its the latter, I wonder if Patrick would care to comment on that---like which ones are the most affected downward --AM/FM radio, print, linear TV, etc.? ---- and who is gaining--streaming, podcasts, digital video, videogames, etc. ?

  2. Leo Kivijarv from PQ Media, April 16, 2025 at 11:01 a.m.

    Ed, you are correct that our data takes into consideration media multitasking, which has only grown in volume since the groundbreaking research by Ball State University in 2005 with the introduction of the smartphone the following decade.  

  3. Gwyneth Llewelyn from Beta Technologies, April 16, 2025 at 11:41 a.m.

    I fully agree with Ed Papazian's comment. This is a picture, but not necessarily the picture. 80 hours a week, as an average? Assuming that the distribution of people watching media follows a bell curve, it would be as Ed says — a substantial number of people would have to be on 24-hour media watching in order to compensate for those who are only "a few hours".

    Also, how exactly are these averages estimated, and what "media" are considered? Reading a web page about something related to work, but which happens to have an ad here or there, does that count as "watching media"? MediaPost has "media" in its name, and I'm answering here, so clearly I'm... watching media? I can see three ads, with the ad blockers turned off, but how exactly relevant are the 10–15 minutes I spent here... or on any of my other 100+ tabs currently opened with things "to-do" or "relevant".

    I'm not questioning PQ Media's numbers at all. They, like everybody else, use a sample, and project their estimates assuming that their sample is representative of everybody and everyone.

    However, I have a background related to academic research, where such claims could never be presented without a bit more data — namely, information about the sample, about what media were used, how data was monitored, and, finally, how the maths was done to come up with those results — and what is the margin of error.

    Assuming that it's a margin of ±5% — which would be a reasonable margin to assume — then the error is wide enough to explain away the 1–2% change, either way; the data is simply not precise to sustain such claims.

    And, as Ed so well said... this is the average of the average of the average, namely:


    • The average of all media (without specifying which)

    • The average of all the members in the sample (which we don't know how representative they are of the overall population)

    • The average age of the sample's members (when we fully know how wildly different the usage is in the different age groups)

    • The average of all the world's countries (in that graph), which begs the question... which countries were considered, and on which was a representative sample actually polled?

  4. Gwyneth Llewelyn from Beta Technologies replied, April 16, 2025 at 11:42 a.m.

    I'm not even talking about those cases mentioned by Ed &mdash; like myself &mdash; when the computer is turned on 24h/day, with or without a human behind it. The same happens to those who turn the TV on but forget to turn it off. And on web-based media, of course, there is the question of how to account for ad blockers, namely, how to predict the "average" number of users with an ad blocker (either deliberately turned on, or integrated in the browser itself).<br /><br />The best that PG Media can offer us, IMHO, is the result of polling a handful of prominent media (both in the US and world-wide) and ask each of them what&nbsp;<em>their</em> data is, and how big their market share is.

  5. Joe Mandese from MediaPost Inc., April 16, 2025 at 11:49 a.m.

    @Gwyneth Llewelyn and Ed Papazian: In my years covering consumer media usage I've reported on many different studies calculating multiple, similatanous, concurrent, etc. consumption of media. I recall one early one conducted by Betsy Frank back in the wayback 90s when she headed research at MTV that found the average American was consuming more time with media than there were hours in a day (still only 24).

    The important thing about PQ's estimates is that they are a stable baseline estimate being tracked over time. There is a lot of value in that too.

  6. Ed Papazian from Media Dynamics Inc, April 16, 2025 at 12:52 p.m.

    Joe, we, at Media Dynamics  Inc have made similar setimates and trended them over the years. The unadjusted figures are in most cases based on the standard "audience" measurements used by each medium----people meters for TV, PPMs for radio, who knows what for digital, consumer claims for print, etc. --and they themselves are variable. For example, for years we were told that an average person aged 12+ spent nearly three hours a per day listening to AM/FM radio--based on flawed diary studies--- only to find that the actual "listening" time was 30% lower when PPMs replaced diaries. And as Nielsen's new big data national TV rating system comes into widespread usage it will---it seems--be reporting about 3-5% more "viewing" than the people meter panel---but is that really an indication that more viewing is taking place? Not necessarily.

    Regarding the point about "multitasking" our best quess is that it happens only 10% of the time but even so we have a hard time buying the idea that when it occurs that both media are being "consumed" at the same time. Not if you base it on attentiveness. Can you be "watching" a TV show while typing a text message or reading one at the same time?

    So based on the fact that the data for all media does not come from a common source or a consitstent methodology and attentiveness is not considered, I'd be careful not to read too much into such trends--unless a they take a firm direction over a number of years and we can determine which media are driving whatever changes are taking place.

Next story loading loading..