Commentary

The Bloviator-In-Chief

We all understand Donald Trump's motive for taking increasingly more of our mental space, but based on a "Red, White & Blog" analysis of the best available data, the tactic may satisfy his ego, but it's backfiring in terms of, well, "attention metrics." Or to use an important ad industry KPI, he is "wearing out."

Nielsen won't release its official viewing estimates for last night's State of the Union Address until the end of the day tomorrow -- breaking from its historic form of reporting them the day after -- due to its transition to its "Big Data + Panel" processing time, so I'm using estimates provided by AdImpact as a proxy.

To be fair, AdImpact's estimates are based on TV device data, so I have no idea how close they will be to what Nielsen ultimately reports, but as I've been saying lately, democracy abhors a vacuum.

In any case, I'll update and revise this analysis as needed based on Nielsen's final tally.

advertisement

advertisement

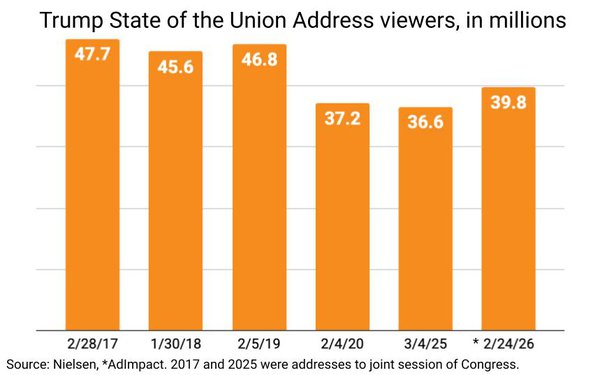
Regardless, Trump's annual addresses have indeed been showing signs of wear-out, not just in terms of total viewers (see below), but average number of viewers per address (see bottom).

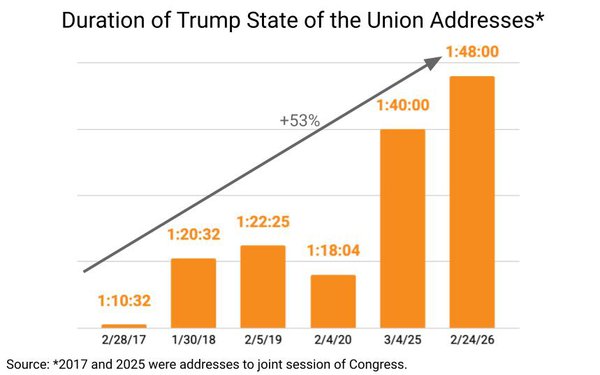
There likely are many reasons for Trump's televised wear-out, but the duration of his bloviated speaking has to be a factor.

The average duration of his addresses during his first term was nearly 80 minutes. Trump 2.0 is averaging 104 minutes so far.

I wish I had other value metrics to throw into this analysis, but the only material one I can address for now is the value of time spent, dividing his viewership by the duration of his addresses over time.

The bottom line: the average audience per minute bloviated has declined 46% from Trump's first address in 2017 through last night's.

11 comments about "The Bloviator-In-Chief".
Check to receive email when comments are posted.
  1. Kevin Killion from Stone House Systems, Inc., February 25, 2026 at 1:29 p.m.

    1) The duration chart at top is misleading, as would be clear if the Y-axis started at zero 
    2) the minute by minute charts would be more informative if they hadn't skipped over the Biden years

  2. Joe Mandese from MediaPost Inc., February 25, 2026 at 1:34 p.m.

    @Kevin Killion from Stone House Systems Inc: So you're saying the duration of Trump's addresses has not increased 56% and his average audience per minute has not fallen 46%. Apologies, I'll check to make sure my calculator is working properly.

  3. Artie White from Zoom Media Corp replied, February 25, 2026 at 1:35 p.m.

    @Kevin the chart title is "Trump SOU Address Million Viewers / Minute." To my knowledge, Trump did not present the SOU during the Biden term.

  4. Dan C. from MS Entertainment replied, February 25, 2026 at 2 p.m.

    Obama's viewership decreased steadily throughout his presidency. His final state of the union was 40% below his peak - which was his first sTate of the union address. 

    Biden's viewership never came close to Trump's numbers.

    On average, Trump's numbers are better than Obama and Biden.  Although it would be interesting to know what streaming numbers are like. 
     

    Apples to apples, it's hard to argue Trump's losing the attention of America during his speeches - bloviation or not. 

    If you were being honest with yourself, you would look at minute by minute, and Obama didn't fare any better. In fact historically, most SOTU speeches decline minute by minute for a variety of factors. 

  5. Joe Mandese from MediaPost Inc., February 25, 2026 at 2:36 p.m.

    @Dan C. from MS Entertainment: This column was about Trump's corresponding increase in the duration of his speeches and the decrease in his audience over time.

    But if I must yield to your whataboutism, I can tell you Obama's eight addresses averaged 38.9 million viewers, while Trump's first six have averaged 42.3 million. We'll see how all eight -- or will it be 12 given his "strange" "third term" quip during last night's address -- end up averaging.

    But the real point is that the more Trump gives of us -- duration-wise -- the lower his audience is. He should take my advice and utilize a less is more strategy, which would be better for all concerned.

  6. Kevin Killion from Stone House Systems, Inc. replied, February 25, 2026 at 2:50 p.m.

    Jow, of course not.  The 58% increase is patience-challenging for sure.  But my comment was about your Y-axis.  By rough measurement, your bar for 2017 is 62 pixels tall, and the 2026 bar is 278 pixels tall.  That's a huge 348% jump, making the increase look much, much bigger than it actually was.  The problem of course is that the Y-axis doesn't start at zero, and this would be obvious if it had been labelled.

  7. Joe Mandese from MediaPost Inc., February 25, 2026 at 3:44 p.m.

    @Kevin Killion: Fair enough, I updated it with the correct baseline. But if you ask me, it looks considerably steeper, albeit a more accurate delineation.

  8. Dan C. from MS Entertainment replied, February 26, 2026 at 6:29 a.m.

    "But the real point is that the more Trump gives of us -- duration-wise -- the lower his audience is."

    It's not about whatisms. It doesn't matter if it's a democrat or a republican, every single president loses more and more audience the longer he speaks.

    Clinton experienced the exact same results when he gave his historically long speeches. Historical numbers illustrate that your "point" applies to every president regardless of party.

  9. Joe Mandese from MediaPost Inc., February 26, 2026 at 8:28 a.m.

    @Dan C. from MS Entertainment: I'm confused. If it doesn't matter if it's a Democrat or a Republican, why do you keep bringing parties up? My column was explicitly about the correlation of two things Trump has been doing: expanding the duration (and setting records) for the length of his addresses, and experiencing a precipitous decline in the audiences viewing those addresses. That's all. There are many other caveats, but that's all I wrote about. Regarding your statement that every president has experienced a fall off in viewers for his addresses over time, it's actually not true. Ronald Reagan sustained his audience over time. He happened to be a Republican.

    Year Type of Address Estimated Viewers Household Rating
    1981 Address to Joint Session* 41.8 Million ~27.0
    1982 State of the Union 40.5 Million 25.8
    1983 State of the Union 43.1 Million 27.6
    1984 State of the Union 41.0 Million 26.2
    1985 State of the Union 45.7 Million 29.1
    1986 State of the Union** 42.4 Million 27.2
    1987 State of the Union 41.1 Million 26.4
    1988 State of the Union 39.2 Million 25.1

  10. Joe Mandese from MediaPost Inc., February 26, 2026 at 8:33 a.m.

    @Dan C. from MS Entertainment: Addendum. Richard Nixon too. Also a Republican. Clearly, it's not about party affiliation, but about the ability to sustain an audience. My point was Trump's better instincts for bloviation is his own worst enemy. Nothing to do with politics. All about him and his dysfunciton.
    Estimated Nielsen Ratings for Richard NixonYearType of AddressEstimated HouseholdsHousehold Rating1970State of the Union~14.2 Million~24.01971State of the Union~15.1 Million~25.51972State of the Union~16.0 Million~26.81973Written Message OnlyN/AN/A1974State of the Union18.4 Million29.5

  11. Ed Papazian from Media Dynamics Inc, February 26, 2026 at 11:02 a.m.

    Joe and Dan, when we talk about TV "ratings" and cite the average minute homes or viewer projections for various years, these are not what most of us who have long dealt with such numbers  would consider ratings" as they do not account for the size of the population bases at each point in time. That's why "ratings" are traditionally represented as percentages of the population in question as this is a far better indicator of relative popularity or program content appeal.

Next story loading loading..