ANA Cross-Measurement Platform Aquila Taps Samba For Streaming Data


Aquila, the Association of National Advertisers' (ANA) cross-media measurement subsidiary, has struck a deal with audience-measurement firm Samba TV to provide streaming viewership data as part of Aquila's process of deduplicating audience reach across TV, CTV and online streaming platforms.

Samba, which derives its first-party viewing data for ACR (automatic content recognition) systems, follows deals that Aquila previously struck with Comscore to provide linear TV viewing data, and with Kantar Media to manage the calibration panel that is at the heart of the reach 
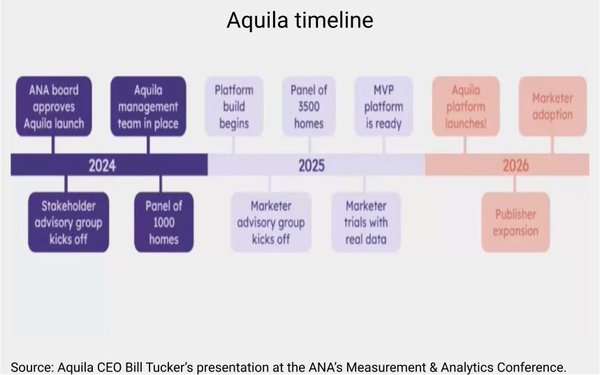
deduplication process. That panel already is installed in more than 3,500 U.S. households, with a goal of getting to 5,000 by the first quarter of 2026.

advertisement

advertisement

During the ANA's recent measurement and analytics conference in September, Aquila CEO Bill Tucker noted that nearly 30 ANA member advertisers have already committed matching funding and have begun trial testing of the data, and that it is on schedule to launch in early 2026.

Aquila estimates the audience reach deduplication component will improve the efficiency of big advertisers' media buys by 10% and will yield $50 million in improved productivity over the first three years.

Aquila and Samba described the streaming data integration as a "multi-phase approach designed for precision and scalability," and said the first phase focusing on "data ingestion and integration" begins this quarter.

"The full solution will provide live, campaign-level measurement capabilities and is expected to be released in the second half of 2026," they added.

10 comments about "ANA Cross-Measurement Platform Aquila Taps Samba For Streaming Data".
Check to receive email when comments are posted.
  1. Ed Papazian from Media Dynamics Inc, October 22, 2025 at 2:38 p.m.

    Don't get me wrong--I totally support this kind of initiative. And the seemingly small sample doesn't bother me at all. It's large enough to get media planning insights--as opposed to show by show findings. But is it going to be based only on set usage--not viewing. That's my question. If the answer is, "Yep--we'll look into viewing later"---then I must confess that I'm disappointed.

  2. Joe Mandese from MediaPost Inc., October 22, 2025 at 3:29 p.m.

    @Ed Papazian: Small sample? I just did a cursory search and found that Samba TV collects data from about 28 million TV devices in the U.S. and 46 million globally and that its weighted research panel is more than 3 million households.

    What's your definition of a small sample?

  3. Ed Papazian from Media Dynamics Inc, October 22, 2025 at 4:53 p.m.

    Joe, in your own article you show a "timeline" chart which calls for 3,500 panel homes using data from both patries which you noted will later expand to 5,000---not 40+ million. That's what I call a small sample.

    There's no way that this project either needs a 40+ million sample or could develop one. It's a melding of info from two separate bases and it's surely operating on a limited budget.

    The goal of 5,000 panel homes is more than enough to obtain usefull media planning data. But if the data is based on "household" audiences--meaning set usage---- not viewing--- the findings may be very misleading. It's much easier to "reach" a household than it is to reach an individual consumer--as we learned 65 years ago. That's why advertisers stopped using household ratings way back in the early 1960s. 

  4. Joe Mandese from MediaPost Inc., October 22, 2025 at 5:28 p.m.

    @Ed Papazian: Oh you were talking about Aquila's calibration panel, not the Samba TV data that will be used to measure the reach/deduplication of the streaming component of its cross-media measurement platform. To be clear, the calibration panel is just a small panel Big Data-plus measurement services are using to calibrate their massive Big Data sources. It's the same model being used by Nielsen and other Big Data-plus panel services. In Nielsen's case, the calibration panel is bigger -- about 42,000 homes/100,000 individuals, but it's not the same as a conventional audience measurement panel. It's just their to tune the massive Big Data sources that go into the hybrid service. I have no idea whether Aquila's 5,000 household calibration panel should be deemed small, but it's not intended to be used as currency-grade measurement for media-buying. It's intended so marketers can understand their audience reach, deduplicate audiences, minimize excessive frequency and inform their marketing mix models. Maybe another reader can weigh in on whether a 5,000 household calibration panel is small to do that? I'm just a journalist.

  5. Tony Jarvis from Olympic Media Consultancy, October 22, 2025 at 5:48 p.m.

    As a memberof the WFA's HALO Industry Tehnical Advisory Group, HITAG, I have expressed serious concerns with device-based and consequently "content-rendered-count" data for Cross Media Measurement, CMM, versus persons-based attention (Eyes/Ears-On at a minimum) metrics program by program or ad by ad, due to the former's associated media biases and relatively poor relationship to campaign outcomes. No attention, there can be no outcomes!  
    HALO, a highly complex multi-faceted construct and base model for CMM initiatives in various countries, has been developed (with the primary support of the technoplolies) to form the basis for the ANA's Aquila and ISBA's ORIGIN currently.  
    However, answers to key questions raised with Aquila are still awaiting response.  They include whether there is a consistent and acceptable definition of "impressions", and/or "viewing", and/or "audience", used throughout all and every data source used and integrated within the HALO/CMM model along with their independently verified validity (walled gardens data?!)?  And, if not, how are they harmonized and made comparable to what final CMM model definition and derivation of sources used or imputed?
    These questions address the industry's fundamental on-going media metrics disconnect.  Are there conflicting defintions of metrics across the various data sources and inputs used to produce a final campaign Reach & Frequency estimate, i.e., What will the final Aquila resulting reach and frequency estimate acually represent?
    In the interests of full disclosure, accountability and transparency, it appears that SAMBA TV relies on ACR data which is solely device-based data together with detailed household profile data from a panel but without persons-based, independently verified, actual measured viewing. If correct (?), SAMBA data would merely reflect content-rendered-counts, aka the oft misrepresented "viewable impressions" (No REAL OTS), on a screen that are likely associated with a projected HH profile of the device owner.  What we used to call circulation/distribution data years ago.  
    If this is the case, Ed's concerns are are on point and advertisers and their media agencies should ensure that these basic concerns are resolved by HALO and Aquila.  As a reminder, high quality samples when independently validated are first representative of a given universe.  Sample size while not unimporant is somewhat secondary and depends on the level of detail being sought, e.g., dayparts (planning) versus show by show or program by program (buyng).  The latter would require a much larger sample than the former.  A non-representative sample however large will always produce specious results.   

  6. Ed Papazian from Media Dynamics Inc, October 22, 2025 at 6:21 p.m.

    Joe, as I understand the ANA project it's designed to allow comparisons of reach and frequency for sample schedules in linear TV and CTV and both in combination. Which is fine--providing the findings reflect people "reach"--by demos--not whether the ads appeared for 2+ seconds on a TV screen
     
    The reason why this distinction is so vital--as we learned 65 years ago--is simply this.Based on set usage, most TV shows peak, "audience"-wise--among younger homes with kids and also  homes with above average incomes. That's because such homes have many more residents who can turn on a TV set than older homes with many fewer residents.

    But who is watching?

    Without exception, the research tells us that older adults far outview younger adults while low brows also top upscale adults by a fair margin. So you get almost totally oppositional findings--depending on how you are measuring "audience" 

    As it happens, we, at Media Dynamics Inc, have just launched a new service called TV AD Cume. This model allows subscribers to input all sorts of hypothetical schedules for broadcast network, cable and syndication as well as several types of CTV buys and see what the monthly reach and frequency would be two ways--one, using standard TV GRPs as provided by the rating surveys and two, adjusting the findings to reflect the percantage of the target group that actually looks at the brand's ads. So far, this model is showing significant add-ons when CTV is combined with linear TV and lots of other interesting stuff. Consequently we are most interested in what the ANA is doing and eager to see some of its results--but for viewers, not homes---please.

  7. Joshua Chasin from KnotSimpler replied, October 22, 2025 at 8:10 p.m.

    Just 2 things.

    1. The Kantar panel deploys people meters, enabling the panelist to provide their individual start and stop times. That puts the Kantar panel on a par with the Nielsen panel as far as viewer (and viewership) identification is concerned. 


    2. As currently designed, the unit of measurement in Aquila is the person, not the household. Comscore is Aquila's linear TV partner, and their data, based on devices, is personified within the household in order to assign viewing to persons. Aquila receives Comscore data at the person level. Similarly, the Samba data will be personified in order to assign viewing to persons. 

  8. Ed Papazian from Media Dynamics Inc, October 22, 2025 at 8:52 p.m.

    Interesting, Josh. But I'm still a bit confused.

    If Kantar is supplying people meter data and Comscore and Samba are supplying set usage data how are the two  measurements reconciled? I gather from your comment that the set usage panels might  attempt to provide viewer data as well as set usage by assuming that if a person in the desired target group resides in a home and the home's set is tuned in then that person is assumed to be viewing. If so, that assumption would generate a viewer-per-set  factor of about 2.5 which is at least double the real figure. 

    So, suppose the ANA looks at a schedule aimed at adults 18-49. If the set usage data from, say, Samba, finds that when a particular home was tuned in when a brand's ad ran on-one of it's screens and one  of its residents happen to be aged 18-49 is he or she considered "reached". And what happens if the people meter data says that even though  one 18-49 adult resides in one of its homes along with a teenager, if only the teen's button is pressed, then only the teen is "reached"--not the 18-49? How is this kind of discrepancy resolved? Whose data takes precedence?

    Answering my own  question, it's possible  that Kantar's people meters will suppply viewer -per -set factors which will be applied  to Comscore's linearTV and Samba's CTV set usage findings. This would work to calculate GRPs--or ad "impressions"--but how  do they cume the data across shows, networks and platforms?

    Again, I'll answer my own question. They may have devised some sort of simulation or ascription process  to create a panel of "synthetic" people --all defined demographically with their ascribed viewing patterns as its core data. Now,  one can do r& f tabs across platforms but one must ask, "Have all,of these statistical manipulations created a distorted picture? 

    Maybe so--but, to be fair,  maybe not. We shall have to see.


  9. Tony Jarvis from Olympic Media Consultancy, October 22, 2025 at 10:42 p.m.

    Josh & Ed: HH data "personified" then used to "assign" viewer presence (e.g. button pushed versus actual viewing)?  Set usage (device ) data assigned/ascribed to persons and viewing?  Three different sources - Kantar, Conscore and SAMBA - each with various and different bases and basis, video behaviour measurements as well as an array of assignments/imputations, etc., etc.  
    So, without truly independent validation of an extremely complex data manipulation and integration, it appears that Ed's "distorted picture" may unfortunately be the case. 
    It appears that at best Aquila/HALO would only deliver a ballpark planning R&F estimate based on the very broadest video input specs at the least dependable simulated persons OTS possible. If this is correct (?), to use such a broadly scoped campaign R&F estimate for outcomes projections is particulary puzzlling beyond the fact that it is the creative that is the primary driver of campaign outcomes albeit with the support of optimal synergisitc media vehicles that "encourage or enhance" real attention for the brand message.  

  10. Ed Papazian from Media Dynamics Inc, October 23, 2025 at 9:05 a.m.

    Tony, while I'm the biggest supporter of ad attentiveness measurements that you will find--which is why it's the key part of our new TV AD Cume service which is now operational--- I'd give this project a pass on that so long as it's findings are based on "viewer" data. In fact the folks at Aquila might want to take a look at our cross platform reach estimates--linear TV plus CTV----as these may herald some of the things they expect to see with their project.

Next story loading loading..