There was a time when Nielsen counted
the number of people watching TV. These days it counts the number of data partners enabling it to model who is watching it.
Take this morning's announcement about a deal renewing -- and
expanding -- its data partnership with CTV platform Roku.
"New multi-year deal integrates Roku's data to fuel Nielsen's measurement suite," proclaimed its press announcement, making me
wonder what a "measurement suite" actually is.
I know Nielsen has panels, services, ratings, and even a "marketplace," but a suite? Sweet!
While details of the expansion and how it
will fuel that suite were not disclosed, Nielsen touted its ongoing relationship with Roku's "large-scale TV data as an input to its Big Data + Panel measurement for both linear and streaming
ratings.
"This will help deliver more accurate performance results for advertisers running campaigns on Roku and across the broader TV landscape," it added without explaining how or
why.
advertisement
advertisement
It reminded me of a column I wrote recently about how big media
agencies used to tout news about their big media buys and media supplier relationships, but lately have been focused more on announcing data-integration deals with partners -- including
Nielsen.
As with the agency data-integration deals, Nielsen's is big on Big Data announcements, not so much on how they actually work.
Earlier this year, DatafuelX's Howard
Shimmel shared some analyses with me showing why Big Data is better.
In March, he provided one showing massive "in-tabs" for its Big Data + panel:
* 4.1 million for
Adults 18+ in Asian Households
* 12.4 million for Adults 18+ in Head of House Hispanic Households
* 11.0 million for Adults
18+ in Head of House Black Households
* 5.9 million for Adults 18+ in Spanish Dominant Households
I never reported on it, because it confused me
that you could have in-tabs -- which represent the percentage of panelists reporting data in a panel -- in a Big Data + panel. I mean, the last time I checked, the panel part of Nielsen's hybrid
system had only about 100,000 panelists (42,000 households) in it.
"These are the estimated sample sizes for Nielsen’s Big Data offering. Remember that they are all subsets of the 45
million total sample," Shimmel replied when I asked him how he was using the term in-tab in relation to this analysis.
Hmm.. I have been thinking about what that actually means ever since, but
this is the first time I'm writing about it.
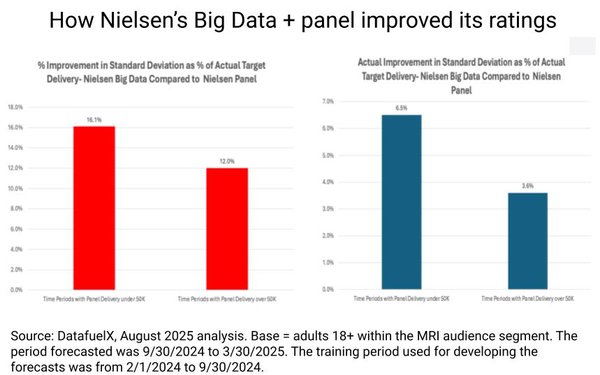
Later, in August, Shimmel shared another DatafuelX analysis indicating that Nielsen's Big Data+ panel methodology is much more stable and
produces more useable data than its old panel-based measurement system (see chart at top).
That's a good thing, considering that it was the whole rationale for Nielsen moving to modeled TV
audience estimates derived from a Big Data database from disparate sources -- including a somehow expanded Roku one -- but it still doesn't answer my apples-to-oranges question.
I know this is
the new way of the media audience-measurement world -- and it's even been blessed by, of all entities, the Media Rating Council -- but I just wonder what it actually represents.
Earlier this
year, I wrote a column about long-time Nielsen and NBCUniversal exec Kelly Abcarian speaking at the CIMM East Summit and pointing out that "every" number we now use in the advertising and media
measurement industry is "modeled."
Again, I don't know if that's necessarily a bad thing. But I used to understand how audience measurement panels worked and I don't understand how Big Data
modeling works and whether the better results are actually meaningful results, or if they're just more useable ones.