Ecommerce experienced price deflation for
the first time in more than two years in July, but consumers spent less in July 2022 compared with June, according to Adobe data that tracks online prices across 18 categories.
Deflation
represents a reduction of the general level of prices in the economy.
The Adobe Digital Price Index (DPI), co-developed with economists Austan Goolsbee and Pete Klenow, identified
deflation driven by electronics, apparel, and toys. Food costs remain high.
The data, released Tuesday, shows that prices dropped 1% year-over-year (YoY) and 2% month-over-month (MoM) in
July.
Consumers have spent about $525.4 billion online in 2022 -- up 9.2% YoY -- but month-over-month, the numbers look a bit different.
Consumers spent $73.7 billion online in July --
down from $74.1 billion in June. Online spending in July also decreased when compared with May. In May, consumers spent $78.8 billion, while in April consumers spent $77.8 billion.
advertisement
advertisement
July is the
first month that ecommerce entered deflation after 25 consecutive months of inflation online. Fourteen out of the 18 categories tracked by the DPI saw month-over-month (MoM) price decreases in
July.
Prices By Category:
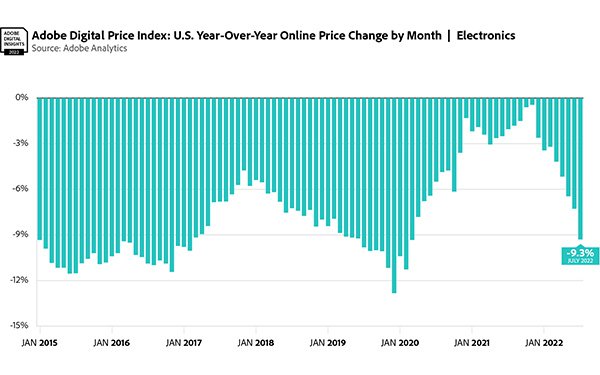
- Prices for electronics, the largest category with 18.6% share of spend in 2021, fell 9.3% YoY.
- Prices for apparel fell 1% YoY, down 6.3% MoM,
marking the second consecutive month where prices fell after dropping 0.1% YoY in June.
- Apparel prices rose for 14 consecutive months since April 2021, with prices having spiked in recent
months -- up 9% YoY in May, 12.3% YoY in April and 16.3% YoY in March.
- Toy prices fell significantly, dropping 8.2% YoY, down 2.9% MoM, a record YoY low for the category in the last 31
months.
- Food costs remained high, with grocery prices rising 13.4% YoY, up 1.4% MoM, a record YoY high and the largest increase of any category.
Compared with the prior year,
the amount consumers spent in July grew 20.9%, with Prime Day driving record online sales for the retail industry overall.
The DPI powered by Adobe Analytics analyzes one trillion
visits to retail sites and more than 100 million SKUs across 18 product categories such as electronics, apparel, appliances, books, toys, computers, groceries, furniture and bedding, tools and home
improvement, home and garden, pet products, jewelry, medical equipment and supplies, sporting goods, personal care products, flowers/related gifts, non-prescription drug and office supplies.
Eleven of the 18 categories tracked by the DPI saw YoY price increases in July, with groceries rising the most.
Price drops were observed in seven categories, including electronics,
jewelry, books, toys, computers, sporting goods and apparel.