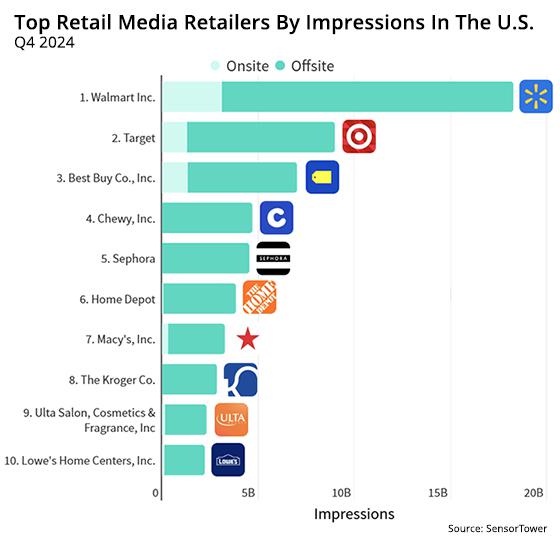
U.S. retail media ad
impressions in the U.S. rose 4% year-over-year (YoY) during the holiday season -- surpassing 75 billion for the first time, according to data released Monday.
A report released by Sensor
Tower, which provides data into the mobile ecosystem, analyzes use in its Q4 2024 Mobile Market Report.
The report measures growth in digital ad channels in the U.S., chatbot downloads, as
well as social networks such as Facebook, Instagram, TikTok and Reddit.
U.S. digital ad spend across mobile, desktop, and over the top (OTT) reached $34 billion in Q4 2024 with 3.8 trillion
impressions. Ad spend climbed 9% year-over-year (YoY).
Among digital ad channels in addition to social media, OTT was the largest, accounting for 13% of U.S. ad spend in Q4 2024. The share of
ad spend on display -- including desktop and mobile -- declined, accounting for 6% of digital ad spend in Q4.
advertisement
advertisement
There was little movement among the top five U.S. advertisers, but several climbed
rapidly into the top 10. The Coca-Cola Company, Liberty Mutual Insurance Company, and Verizon Communications each climbed around 20 spots.
Coca-Cola focused its ad push on social media
channels including TikTok, Instagram, and Snapchat. Liberty Mutual's main ad channel was YouTube, while Verizon's top channel was OTT.
Walmart's digital ad spend climbed past that from Google
and NBC Universal Television as it ramped up spend for Black Friday and Christmas shopping. The remainder of the top five advertisers were unchanged from the Q3.
Amazon topped advertiser spend
for digital in the U.S. It also experienced the largest increase in ad spend in Q4 compared to the prior quarter. This included increases in ad spend for its subscription services like Audible, Prime
Video, and Amazon Music.
Google came in at No. 4, behind Amazon, Procter & Gamble, and Walmart.
A few U.S. advertisers also increased their digital ad spend on gaming, including
Epic Games campaigns for Fortnite and Microsoft increasing ad spend for Xbox.
Social accounted for approximately 77% of digital ad spend in Q4 2024 -- about 77 cents of every dollar spent
for IAP.
Facebook and Instagram accounted for nearly half of all spend, followed by YouTube at 11% and TikTok at 7.2%.
Overall, revenue from global IAPs for one-time
purchases, subscriptions, and paid apps reached $39.4 billion across iOS and Google Play in Q4 2024. Revenue growth accelerated in recent quarters, with IAP revenue climbing 13.5% year-over-year
(YoY).
In total, global IAP revenue reached $150 billion in 2024 -- a 12.5% YoY increase.
IAP revenue in the U.S. rose by $1.47 billion between Q4 2023 and Q4 2024. U.S. revenue from
IAP in the U.S. more than doubled during the past five years.
The report also details other regions.
Across all regions, IAP revenue in non-games climbed 28.2% YoY to $19.2 billion.
App revenue is also approaching that from games, trailing by only $1 billion in Q4 2024, compared with a nearly $5 billion gap in Q4 2023.
While YouTube and Google One surpassed
TikTok's Q4 total in the entire calendar year for the non-game category only, one stat in the report stands out. Consumers spent $6 billion on in-app purchases in TikTok, including Douyin in
China -- up from $4.4 billion in 2023.
In Q4 2024, TikTok approached a record high of $1.9 billion in gross IAP revenue.
ChatGPT's rise continued into 2025, reaching into the top 10 by
revenue in Q4 2024. The app's IAP revenue surpassed $225 million for the quarter as it ranked between the popular streaming service Max and video editing app CapCut.
Google Play at 73.6%
comprised the majority of the downloads, while iOS accounted for roughly 70% of IAP revenue in Q4 2024.