I don't know how many press releases I've received
from Nielsen since I began covering them in the early 1980s, but if I'd had to guess, I'd say it's been at least a thousand. But the one I received this morning stuck out like a sore thumb, because
the headline seemed to be making too much of a case for one of its best-paying customers:
"Warner Bros. Discovery Owns Largest Monthly Viewing Increase in Nielsen Report Due to March
Madness and Max Streaming Growth"
The release -- one of Nielsen's regular monthly "The Gauge" analyses with aggregated total TV usage by each of the major "distributors" (including their
streaming services) -- went on to note that WBD "exhibited 3% growth in television viewing compared with February, primarily driven by March Madness coverage on TBS, TNT and truTV. Tournament games
were also available to stream on Max, which allowed for additional reach to notably younger consumers."
advertisement
advertisement
While all that may be true, the big question is why Nielsen was touting WBD's
sequential, month-to-month audience growth. Never mind that it was comparing a month with the NCAA coverage in it to one that had none. You know, apples to oranges.
A more honest way to
compare audience growth -- or declines -- would be to look at the same month, year-over-year.
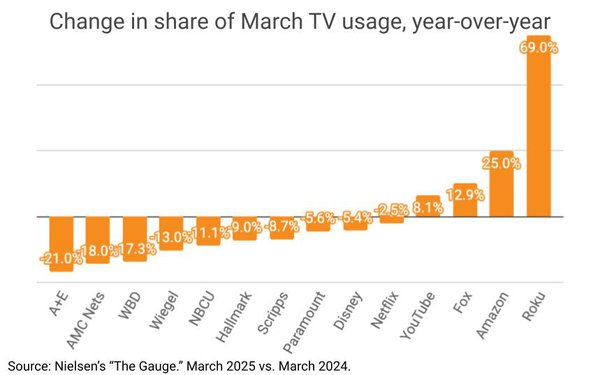
And that's what I did in the chart above, which shows WBD's aggregate TV usage falling 17.3%, the
third worst of any distributor measured by Nielsen, and just behind A+E's 21% drop and AMC Networks' 18.0% decline.
In fact, 10 of the 14 companies Nielsen reports in its monthly distributor
analysis declined, including one pure-play streaming service, Netflix.
The other four -- YouTube, Fox (which owns the popular Tubi streaming platform), Amazon (which owns Prime Video) and CTV
and streaming platform Roku, all shot up on a year-over-year basis, especially Roku.
I'm calling this out for several reasons, including the fact that Nielsen's "distributor" Gauge is a
relatively new, but has become the primary way Nielsen likes to talk about TV usage trends, which is on a co-mingled, aggregated linear/non-linear basis.
The other reason is to alert media
planners and buyers heading into this year's upfront marketplace to be careful about reading releases from Nielsen, or any of its customers, touting short-term, sequential changes without comparative
baselines.
To me, this one felt a little like a sponsored post.
The funning thing is that historically Nielsen, of all sources, was always so guarded about the way people -- customers,
advertisers, agencies, and even the press -- could source its data publicly, and had explicit rules for not touting or misrepresenting their findings.
Live and learn.