Ecommerce giants like Amazon may attribute a slight
drop in sales to the re-opening of the economy and return of shopping in brick-and-mortar stores. But data released Wednesday from Liftoff, a global performance-based mobile app marketing optimization
company, and App Annie, a global data and analytics company, tells a different story.
Amazon fell short of analysts’ estimates for revenue in its second-quarter results,
although it posted the third $100 billion quarter in a row. It was the third revenue miss in three years.
The 2021 Mobile Shopping Apps Report, Sizing Up The Future Of Retail reveals key insights into consumer purchase behavior, suggesting that mobile retail is here to stay, regardless of in-store
openings. From January to May 2021 -- as vaccines rolled out -- mobile purchase rates spiked 30%.
advertisement
advertisement
Purchases spiked, with shopping baskets hitting a high of $88 in June 2021, compared with
January’s high of $74 -- up 15.8%.
Drawing on more than 95 billion impressions, the report also sees Android pull ahead of iOS, with users spending 2 billion hours per week in
retail apps. There were 1.1 billion clicks across 14 million installs, and 39 million in-app events between June 1, 2020 and June 1, 2021.
With back-to-school in full swing and the
holiday shopping season around the corner, the data shows an interesting twist for marketers.
The analysis highlights how consumers flocked to mobile retail amid COVID-19 restrictions,
boosting a years-long trend of increased adoption in the sector.
Globally, the report shows that mobile users spent 49% more time on these apps since January 2020, reaching nearly 18 million
hours spent weekly in April 2021.
The report also notes a 54% jump in APAC for time spent in apps, followed by 40% in the Americas and 38% in Europe and the Middle East.
Mobile buying
continues despite the initial global re-opening period -- a promising trend for app developers.
Android edged out iOS as the leading platform for retail. Android users were highly engaged with
shopping apps, spending a collective 2 billion hours per week on these apps as of May 2021, up 51% year-over-year.
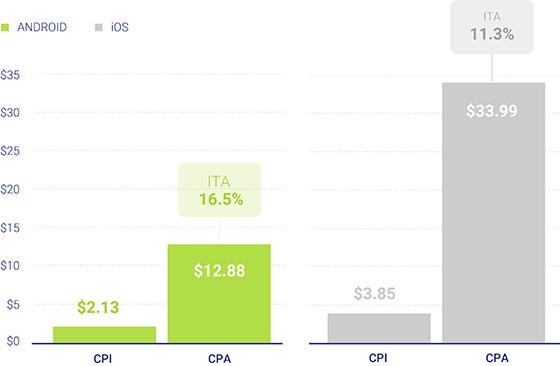
The report found that Android’s $2.13 cost-per-install (CPI) was 55%
less expensive than the $3.85 of iOS, while simultaneously offering a greater install-to-action rate: 16.5%, compared to the 11.3% of iOS.