Out-of-home (OOH) advertising took a
beating in parts of 2020 due to the COVID-19 pandemic, but analysts and advertisers say ad dollars are coming back this year.
eMarketer expects U.S. OOH ad spend to increase 14.5% this year to
$6.96 billion, but does not expect the media to be evenly distributed.
Marketers will transact about 3.9% of total OOH ad spend via programmatic this year.
eMarketer calls programmatic
a subset of digital outdoor advertising that accounts for about 12.5% of DOOH ad spend in 2021 and 16.4% in 2022.
The Place Exchange (PX) Programmatic OOH Trends report provides a similar
snapshot of select spending patterns within the platform after analyzing delivery across billions of impressions.
Lynda Liu, Marketing Director, Place Exchange, said programmatic
video OOH spend is growing incredibly rapidly. "The vast majority of DOOH screens support high-resolution video, offering massive reach of audiences with life-sized video creatives that are always
viewable, brand-safe, bot-free, and can't be skipped or paused," she said.
advertisement
advertisement
The report, which compares data from H2 2020 with first-half 2021, shows signs of recovery from the
pandemic.
Top spending categories in H2 2020 were Government and Politics at 22% of spend, and Health and Fitness at 18% of spend.
Food and Drink comprised 10% of spend. All other
categories — from Technology and Computing to Arts and Entertainment — came in below.
In first-half 2021, the top-spending categories shifted to Food and Drink at 31% of spend and
Personal Finance at 24% of spend.
The shift demonstrates a focus on cycles impacted by the pandemic in first-half 2021, according to the data. At this time, Travel began to show growth.
Advertising categories with the highest growth include Personal Finance at 577%, Food and Drink at 275%, and Travel at 167%.
OOH spending in NYC increased significantly in first-half 2021,
when comparing the two time frames reflects the impacts as one of the largest cities re-opened.
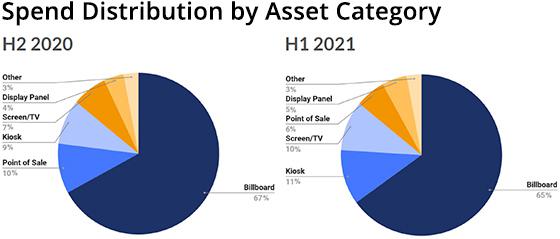
Billboards garnered 67% of programmatic OOH spend in second-half 2020, but other asset
categories also attract material share such as Point of Sale at 10%, Kiosks at 9%, TV Screens at 7%, Display Panels at 4%, and Other like elevator displays and free-standing enclosures or bus shelters
at 3%.
In H1 2021, those numbers shifted to Billboards at 65% of Programmatic OOH spend, Kiosk at 11%, TV Screens at 10%, Point of Sale at 6%, Display Panel at 5%, and Other at 3%.
The
average cost-per-thousand impressions (CPMs) across virtually all OpenOOH venue categories in PX rose from second-half 2020 to first-half 2021, between 10% and 30%. Point of Care fell in first-half
2021 to $9.21, from $10.07. Office Buildings saw the highest jump at $7.11, up from $4.14.
Spending on programmatic Video OOH advertising roughly doubled from second-half 2020 to
first-half 2021.
Non-Guaranteed deals continue to dominate programmatic OOH buying execution, at about 90% of spend.