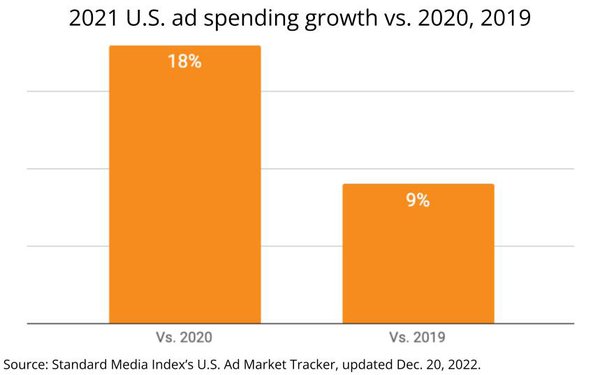
The U.S. ad market has fully recovered from the recession of 2020-21,
with full calendar-year spending rising 18% vs. 2020, and 9% vs. 2019, according to a Standard Media Index analysis of the U.S. Ad Market Tracker, a collaboration with MediaPost indexing total U.S. ad
spending from the pool of agency holding companies and independent agencies' actual media buys.
A separate analysis of month-by-month data by MediaPost, however, reveals that the expansion has
been decelerating through year-end 2021 (see related story).
As robust
as the recovery has been, SMI's analysis indicates it has been far from even across the major media.
While digital media have surged at double-digit increases throughout 2021, the picture is
far more erratic for TV, radio, out-of-home and print media, according to a quarterly analysis conducted by SMI (see table below).
advertisement
advertisement
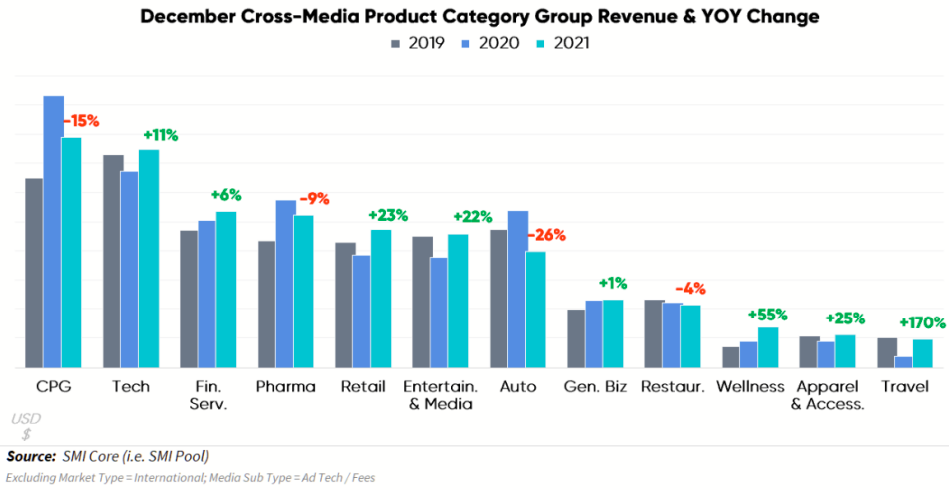
The recovery also has been far from even in terms of key
advertising categories, according to another analysis compiled by SMI's analysts (see chart at bottom), which shows big ones like automotive and consumer packaged goods receding at double-digit rates,
while many others expanded at double-digit rates.