

Commentary
Time Spent In Shopping Apps Exceeded 100B Hours In 2021
- by Karlene Lukovitz @KLmarketdaily, April 7, 2022

How rapidly is mobile shopping accelerating?
Well, worldwide, total annual hours spent inside shopping apps—on Android phones only — increased more than 18% last year, to 100.5 billion from nearly 85 billion in 2020, according to data.ai (formerly App Annie).
That works out to an average of about 2 billion hours per week.
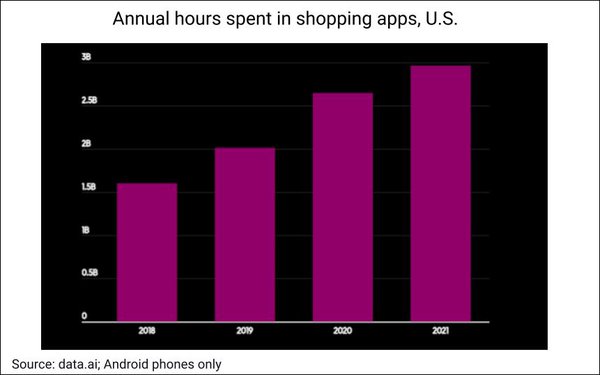
Meanwhile, in the U.S., annual hours in these apps rose more than 12%, from 2.65 billion in 2020 to 2.97 billion last year.
The numbers are even more impressive on a three-year timeline.
Worldwide, annual hours have more than doubled since 2018, when they logged in at 48.7 billion.
In the U.S., they’re up 54%, from 1.6 billion in 2018:
Most sectors saw growth, but the biggest jumps were seen in fast fashion, social shopping and mobile-savvy big-box players.
Looking at the top 20 shopping apps worldwide in terms of year-over-year growth in downloads, No. 1 was India’s Meesho — actually a B2B product. It powers an online marketplace that connects small and micro business owners with customers via social media channels including WhatsApp, Facebook and Instagram.
Meesho, which raised $570 million in funding at a valuation of $4.9 billion last September, is targeting 100 million users by the end of 2022.
Singapore-based Shopee was No. 2 in downloads growth but No. 1 in monthly active users worldwide. Now active in 13 countries across Asia, Latin America and Europe, Shopee $6.1 billion in gross
orders last year — up 117% year-over-year.
Just two U.S.-heaquartered apps made the top 20 by download growth: Nike, at No. 15, and PatPat, known primarily for kids’ clothing, at No. 19.

Globalization is very much the trend in shopping apps.
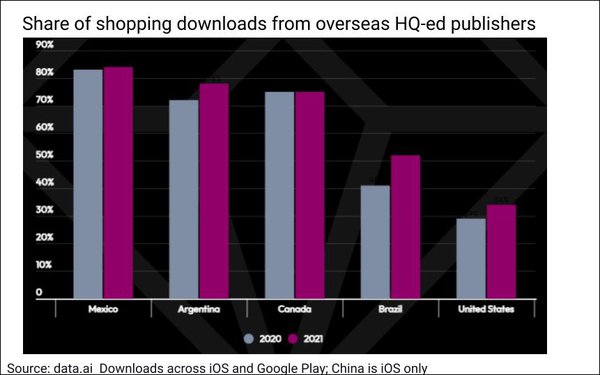
In Mexico, fully 84% of total shopping-app downloads are apps from companies headquartered outside of Mexico.
Other countries with notably high use of non-domestic apps include (78%), France (77%), Australia (75%) and Canada (75%).
In what can be read as good news from a brand loyalty standpoint, the U.S. lags other countries in this regard.
Although the percentage of downloads from other countries rose from 29% to 34% in the U.S. between 2020 and 2021, that means that 66% of shopping downloads are still from U.S.-based brands.
The shopping apps trends data is taken from data.ai's State of Mobile 2022 report.


Karlene Lukovitz is editor of MediaPost's "Digital News Daily" and writes the weekly "Video Insider" and "Advanced TV Insider" columns. You can reach her at karlene@mediapost.com.